Markets Respond to a Global “Time Out”
By Theresa Gusman, Chief Investment Officer
- The US equity market was persistently hitting new highs following a 31.5% gain last year – until a few weeks ago. This surge drove the Dow Jones Industrial Average to an all-time high of 29,551 on February 12th.
- Then the bottom fell out. In response to the spreading coronavirus pandemic and resultant global “time out”, the S&P 500 plunged 33.9% from its peak on February 19th to its trough on March 23rd.
- For the quarter, US stocks lost 20.6% and global equities fell 24.0%. The healthcare (-13.9%), technology (-14.4%), and utilities (-15.5%) sectors fared best.
- Energy stocks had their worst quarter ever, falling 53.4% as oil prices plunged 66.4% to $20.50 per barrel from $61.10 at the start of the year.
- Strategies incorporating environmental, social, and governance (ESG) factors broadly outperformed traditional strategies and indices in the first quarter as the emphasis shifted to quality and sustainability during the “flight to quality” and energy related companies, which are often excluded from ESG strategies, underperformed.
- Uncertainty surrounding the virus led to a sharp rise in volatility. In mid-January, we noted, “according to the Wall Street Journal, the stock market is in one of its longest historic streaks without a daily move of 1% or more”. In contrast, in March, there was only one day where the S&P 500 did not move by more than 1%.
- Attention is now beginning to turn to the trade-off between easing the “time out” that has crippled the global economy and spurring new outbreaks of COVID-19. The effort to balance these two conflicting and potentially disastrous outcomes has created a no-win situation for policymakers – and set the backdrop for continued market volatility and unpredictability in the coming months.
First Quarter Market Review
In our fourth quarter market commentary published in mid-January, we concluded, “amid the improving global economic and earnings backdrops, markets look poised to continue to shrug off myriad geo-political risks and stretched valuations in the near term”. How quaint. Even more recently – just 10 weeks ago – the US equity market was persistently hitting new highs following a 31.5% gain last year. This surge drove the Dow Jones Industrial Average to an all-time high of 29,551 on February 12th.
Then the bottom fell out:
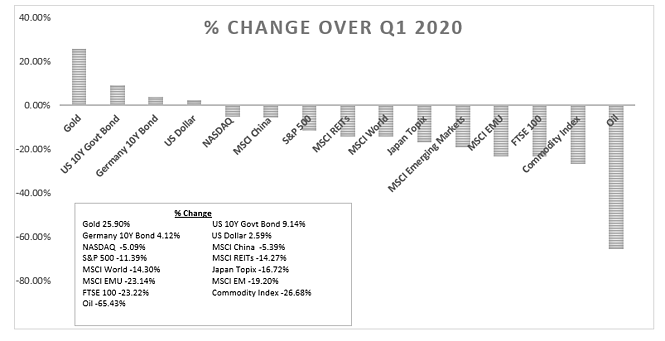
As shown in Figure 1 (below), the coronavirus pandemic resulted in a severe “risk off” event as the quarter progressed. Only 10-year US treasuries and the 10Y Bund showed positive returns, with most equity markets falling 20% or more, and oil plunging by more than two-thirds. Gold, the traditional “safe haven” edged up 13.6%.
Figure 1. Coronavirus impact on asset performance, 12/31/2020 to 03/31/2020 (Source: FactSet)
- As reported by Morningstar, US large growth funds (down 15.5%) continued to perform best in the first quarter, followed by mid-cap growth and large blend. Value continued to lag, with small, mid, and large value falling by 36.9%, 32.5%, and 26.8%, respectively, in the wake of the plunge in energy and financial stocks. For each of the value categories, the declines were the largest in the 23-year histories of the three Morningstar value indexes – even worse than the 2008 global financial crisis losses – according to Morningstar,
- International equity market performance reflected the “shape of the coronavirus curve” in each country. China (-11.4%) and Japan (-18.2%) – whose curves seem to be flattening – performed best and Latin America (-46.8%) and India (-31.8%), which are likely in the early stages of the pandemic, performed worst.
Outlook – Transition from Global “Time Out” to No-Win Situation
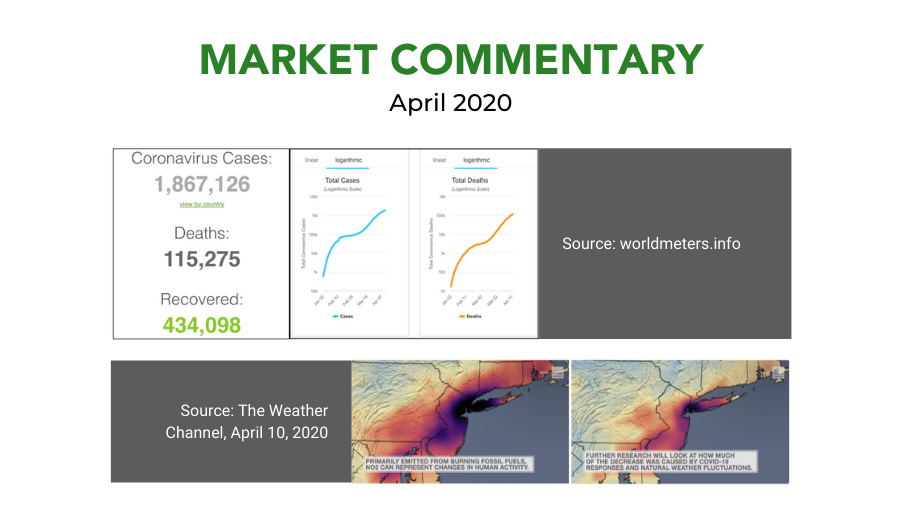
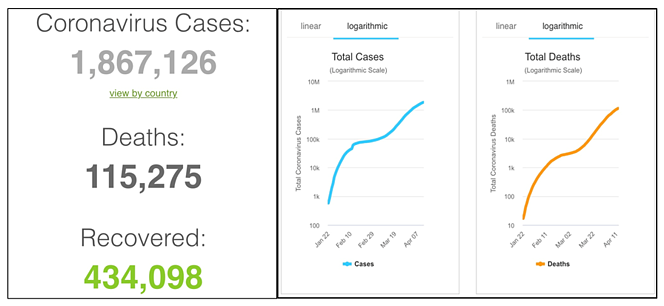
The latest data indicates coronavirus infection rates in the US may be stabilizing and the number of new cases in other global hotspots could be declining (see Figure 2). As a result, policy makers have begun to discuss easing the “time out” that has crippled the global economy. Although battling the current pandemic remains our collective top priority, attention is beginning to turn to the tradeoff between stimulating economic activity by lifting current social distancing, business, and education restrictions and the potential for spurring new outbreaks of the disease. A careful balance must be maintained between the prospective economic and human costs, creating a no-win situation for policymakers – and setting the backdrop for continued market volatility and unpredictability in the coming months.
Figure 2: Covid-19 Coronavirus Pandemic, April 13, 2020 (Source: worldmeters.info)
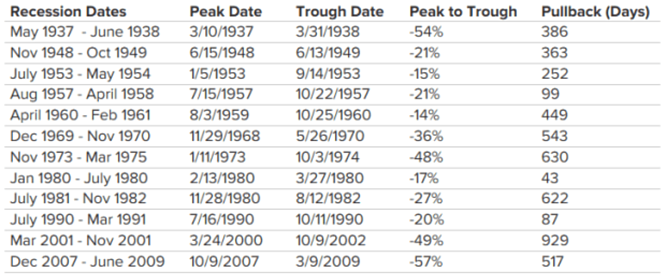
We’ve seen a great deal of speculation on the shape (U, V, W, or the dreaded L) and longevity of the impending global recession and ultimate recovery. The historic data is presented in Figure 3. However, we’ve yet to identify economic and market downdrafts as sharp and sudden as the current shutdown-induced declines.
Figure 3. S&P 500 Peak to Trough Around Recessions, 1937-2009 (Source: RBC US Equity Strategy, Haver, S&P. 1945 recession excluded)
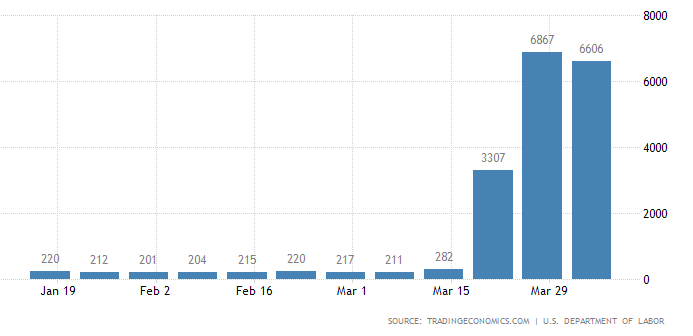
The sharp, immediate, unprecedented impact of the global economic shutdown is best observed in the unemployment claims data shown below (see Figure 4). In the three weeks ended April 4, 2020, nearly 17 million Americans lost their jobs. This means roughly 10% of workers filed for unemployment in three weeks, and the US unemployment rate has likely hit 14.7% — the highest level since 1940 and up sharply from 3.5% in February.
Figure 4. Seasonally Adjusted Initial Jobless Claims, 1/19/2020-4/4/2020(Source: TRADINGECONOMICS.COM | U.S. DEPARTMENT OF LABOR)
Looking at emerging unemployment data, it is not surprising that according to Bloomberg, Wall Street banks warn the coronavirus pandemic will plunge the world into its deepest peacetime recession since the 1930s, robbing the global economy of more than $5 trillion of growth over the next two years. However, with policy decisions geared toward “reopening the economy” coming fast and furious, nobody really knows how deep the immediate downdraft will be, how long the recession will last, or how the “new normal” will look.
Bloomberg’s collective “Wall Street” predicts that although downturn will be short-lived, it will undoubtedly take time for economies to make up lost ground. Even with huge monetary and fiscal stimulus, they say, “gross domestic product is unlikely to return to its pre-crisis trend until at least 2022”.
Against the backdrop of persistent personal and collective fear of both a rapid, unprecedented global economic implosion and an easily transmitted disease for which there is no cure, no vaccine, and unpredictable, sometimes fatal symptoms, we anticipate ongoing market volatility and possibly the retesting of March lows in the current quarter.
Earnings – Rapidly Deteriorating
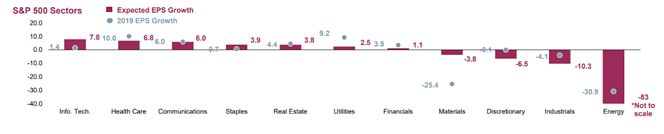
Keeping in mind that earnings projections are falling as quickly as economic activity is deteriorating, current earnings projections by regions, styles, and sectors are presented in Figures 5 and 6. Earnings adjustments will be negative for the foreseeable future, and we would be surprised if any region, style, or sector posted an increase in earnings in 2020.
Figure 5. Corporate Earnings Growth, Regions/Styles (3/31/2020) (Source: FactSet as of 3/31/2020. Expected EPS Growth is the % change in EPS growth from the beginning of the current calendar year through the end of the calendar year. 2018 EPS Growth is the % change in EPS from the beginning of the year through the end of the year)
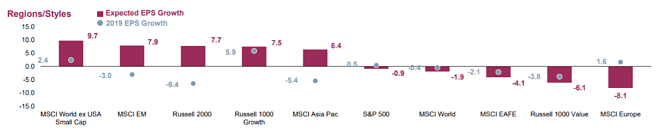
Figure 6. Corporate Earnings Growth, S&P 500 Sectors (3/31/2020) (Source: FactSet as of 3/31/2020. Expected EPS Growth is the % change in EPS growth from the beginning of the current calendar year through the end of the calendar year. 2018 EPS Growth is the % change in EPS from the beginning of the year through the end of the year.)
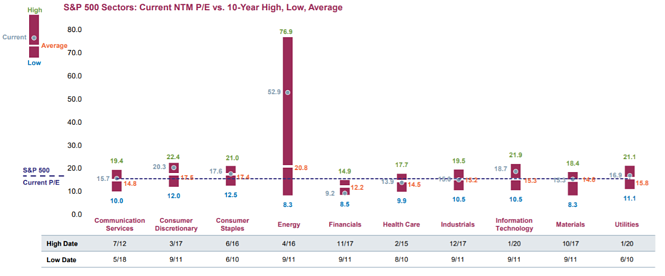
Valuations – A Moving Target
Despite the first quarter fall in stock prices and current too high earnings projections, equity valuations remain above their 10-year averages. The S&P 500 and Russell 1000 Growth indices remain at the highest valuations relative to their historic averages (see Figure 7). The MSCI AC Asia Pacific and Russell 1000 Value indices are least expensive on this metric (see Figure 8).
Figure 7. Equity Valuation Analysis, Regions/Styles, 3/31/2020 (Source: FactSet as of 3/31/2020. NTM P/E is market price per share divided by expected earnings per share over the next twelve months.)
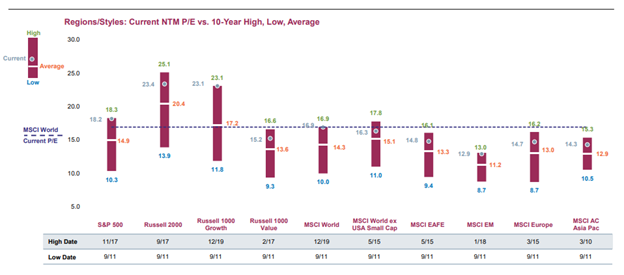
Figure 8. Equity Valuation Analysis, S&P 500 Sectors, 3/31/2020 (Source: FactSet as of 3/31/2020. NTM P/E is market price per share divided by expected earnings per share over the next twelve months.)
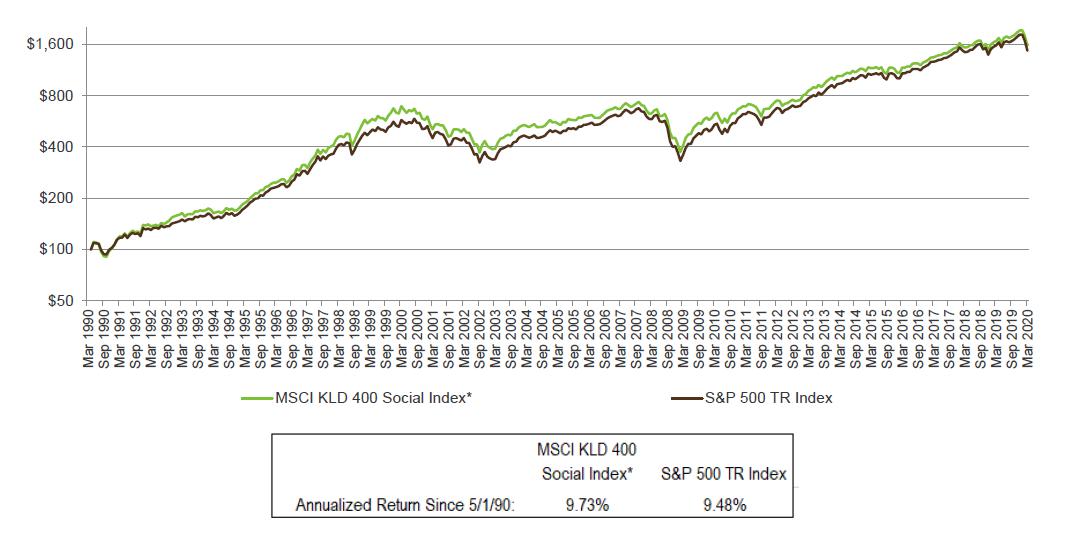
Achieving Long-Term Investment and Impact Objectives
As shown in Figure 9, the MSCI KLD 400 index outperformed the S&P 500 index in the first quarter. The sustained, consistent performance of this standard SRI/ESG benchmark over time and recent out-performance support our view that strategies incorporating environmental, social and governance (ESG) factors – with an eye toward making the world a better place – and mainstream financial returns are not mutually exclusive.
Figure 9. MSCI KLD 400 vs S&P 500 Indices, March 31, 2020 (Source: Morningstar. *Data prior to 9/1/2010 is that of the MSCI KLD 400 Social Index GR, while data since 9/1/2010 is that of the MSCI KLD 400 Social Index NR. Indexes are unmanaged groups of securities. Index performance does not include the impact of cash, fees, or transaction costs. Investors cannot invest directly in indexes but may purchase mutual funds or other investment products designed to track the performance of various indices.)
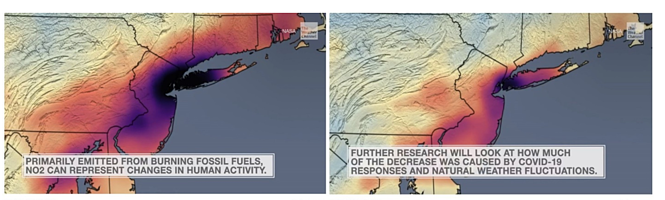
Amid the sea of negative economic and human consequences of the global “time out” response to the coronavirus, the environmental impact has been unquestionably positive. As shown in Figure 10, air pollution over the northeast has declined dramatically, with NO2 levels falling to the lowest levels since tracking began in 2005. We’ve also seen cleaner water, the return of fish and wildlife to previously deserted locations, and far less plastic on the beaches. Let’s hope the environmental benefits of the current crisis persist well into the future.
Figure 10. Coronavirus Response Contributes to Drop in Air Pollution Over Northeast (Source: The Weather Channel, April 10, 2020)
As always, everything we do at First Affirmative is driven by our dedication to enabling advisors to deliver financial results to clients and belief in the power of capital to bring about lasting environmental and social change. Our three Sustainable Investment Solutions – Custom, Multi-Manager, and Managed Mutual Fund – are built to enable clients to achieve their financial goals over the long term, along with their individual environmental, social, governance, ethical, and values-based objectives. Each portfolio is carefully constructed to be well diversified across assets, sectors, geographies, securities, and management styles –– and designed to weather periods of uncertainty and volatility.