It’s (still) the Earnings…
By Theresa Gusman
- Ushering in a period of asynchronous and decelerating global economic and profit growth and negative earnings surprises, equity markets fell amid volatile trading in the fourth quarter, erasing gains for the year in the US.
- US equities slid 13.5% in the fourth quarter, overwhelming increases through the first nine months and resulting in a 4.4% decline for the year.
- The globally sensitive Energy (-18.1%), Materials (-14.7%), and Industrials (-13.3%) S&P 500 Sectors were the worst performing in 2018, and Health Care (+6.5%), Utilities (+4.1%), and Consumer Discretionary (+0.8%) fared best.
- Although the pace of decline in non-US equity markets slowed in the fourth quarter, emerging markets fell 14.6% in 2018, as developed international markets dropped 13.8%.
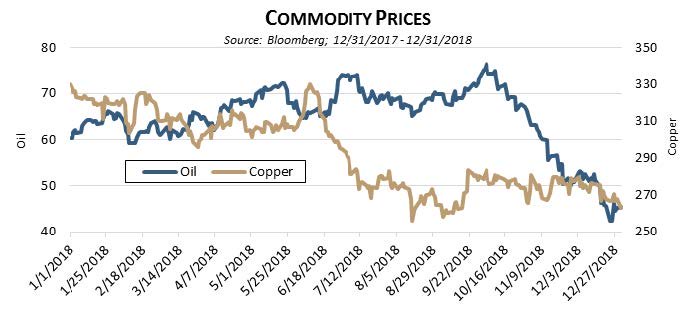
- Except for Wheat (+3.6%) and Live Cattle (+2.6%), commodity prices ended the year lower. WTI Crude Oil plunged 20.5% in 2018 and 37.5% in the fourth quarter and economic bell weathers Zinc (-23.4%) and Copper (-21.3%) were among the worst performers in 2018.
2019 Outlook — Modest Equity Returns Amid Higher Volatility
The US enters 2019 with a strong economy and exceptionally low unemployment. However, economic growth is past its peak, housing continues to weaken, and indicators of future business activity are slowing. Internationally, economic activity has deteriorated throughout Europe, and Brexit and social unrest present wildcards; China has decelerated precipitously in the wake of its trade war with the US; and emerging markets are feeling the pinch of slower global growth and lower commodity prices.
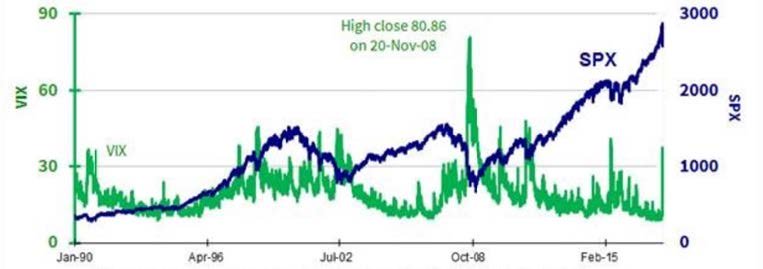
In this environment, we anticipate modest equity returns amid higher volatility – to both the downside and the upside. The chart below shows the performance of the CBOE Volatility Index (VIX), a measure the stock market’s expectation of volatility, and the S&P 500. Like the fourth quarter 2018 downdraft, past VIX spikes have coincided with brief – albeit gut-wrenching – market declines followed by slower rebounds in recent years. We believe the fourth quarter fall set the stage for a modest rise in stock prices over the next 12-months. However, with the market’s fundamental underpinnings deteriorating and broad valuations at the mid-point of their 10-year range, we believe allocation across sectors, industries, and individual stocks will play a larger role in investment outcomes in 2019.
Figure 1. VIX Index and S&P 500 (SPX) Index, 1/1/90-2/8/18
Earnings Growth to Decelerate
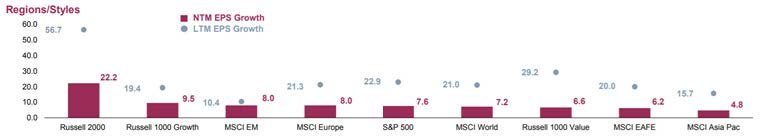
Against the backdrop of a slowing US economy, the fading benefits of the US corporate tax cut, and continuing sluggishness internationally, we anticipate a significant deceleration in the pace of earnings growth over the next several quarters. In our third quarter Market Commentary, we noted that, “blockbuster earnings growth continues to drive the US equity market – but it won’t last forever”. As we enter 2019, Factset’s tabulation of bottom-up earnings projections points toward a decline in the rate of S&P 500 earnings growth to 7.6% in 2019 from 22.9% in 2018, as EAFE constituent growth slows to 6.2% from 20.0% (see Figure 2.)
Figure 2. Corporate Earnings Growth, Regions/Styles (12/31/18)
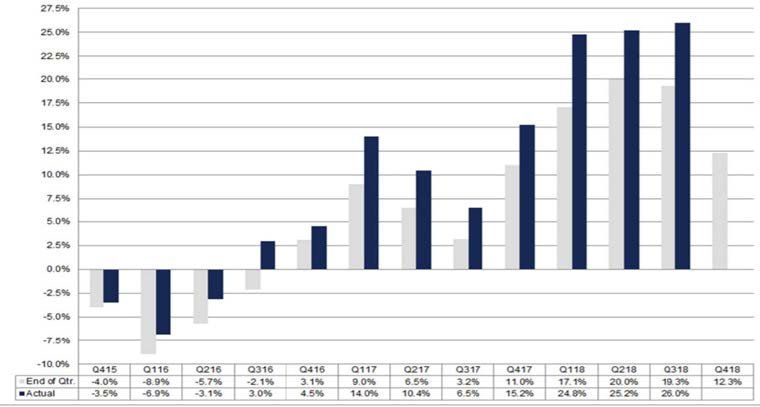
Although we would like to believe the magnitude of the likely earnings deterioration has been captured in next 12-month EPS forecasts, we do not. In our experience, earnings surprises are like cockroaches – there’s never only one. In fact, according to Factset, over the past five years, actual earnings reported by S&P 500 companies have exceeded estimated earnings by 4.8%, on average — and by significantly more in recent quarters — as earnings growth accelerated (see figure 3). Just as forecasts lagged reality on the upside, we anticipate “negative earnings surprises” as companies and analysts scurry to catch up with deteriorating momentum over the next several quarters. Interestingly, with the predictable roll-off of the earnings benefits of US corporate tax cuts, the magnitude of negative earnings surprises associated with the current loss of economic momentum might be more muted than previous periods.
Figure 3. S&P 500 Earnings Growth: End of Quarter Estimate vs. Actual, Q415-Q418
Valuations at or Below Historic Averages
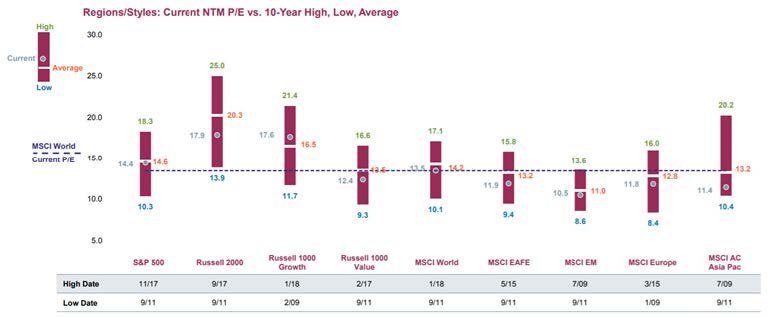
The fourth quarter downdraft in global equity markets reduced valuations to at or below 10-year average PE ratios – with the notable exception of the R1000 Growth index (see Figure 4). We anticipate continued volatility and mixed, choppy returns across stocks, sectors and geographies amid the reality of reduced earnings expectations in the coming months. However, barring an economic recession, we are looking for modest overall gains in equity markets in 2018.
As always, everything we do at First Affirmative is driven by our dedication to enabling advisors to deliver financial results to clients and belief in the power of capital to bring about lasting environmental and social change. Our Sustainable Investment Solutions are built to enable clients to achieve their financial goals over the long term — along with their individual environmental, social, governance, ethical, and values-based objectives. Each portfolio is carefully constructed to be well diversified across assets, sectors, geographies, securities, and management styles –– and designed to weather periods of uncertainty and volatility.
Figure 4. Equity Valuation Analysis, 12/31/08-12/31/18
Quarterly Performance Benchmarks
| Passive Benchmarks* | Q4 2018 | YTD | 1 Year | 3 Year** | 5 Year** |
| S&P 500 Index | -13.52 | -4.38 | -4.38 | 9.26 | 8.49 |
| MSCI KLD 400 Social Index | -12.59 | -4.02 | -4.02 | 8.56 | 7.54 |
| DJIA (reinvested dividends) | -11.31 | -3.48 | -3.48 | 12.94 | 9.70 |
| S&P MidCap 400 | -17.28 | -11.08 | -11.08 | 7.66 | 6.03 |
| Russell 2000 (Small Cap) | -20.20 | -11.01 | -11.01 | 7.36 | 4.41 |
| MSCI EAFE (Europe, Australasia, Far East) | -12.54 | -13.79 | -13.79 | 2.87 | 0.53 |
| MSCI Emerging Markets | -7.47 | -14.58 | -14.58 | 9.25 | 1.65 |
| Bloomberg Barclays Aggregate Bond | 1.64 | 0.01 | 0.01 | 2.06 | 2.52 |
| Morningstar Mutual Fund Benchmarks | Q4 2018 | YTD | 1 Year | 3 Year** | 5 Year** |
| U.S. Large Cap Growth | -15.43 | -2.09 | -2.09 | 8.98 | 8.16 |
| U.S. Large Cap Value | -12.49 | -8.53 | -8.53 | 6.85 | 5.37 |
| U.S. Mid Cap Growth | -17.57 | -6.65 | -6.65 | 7.27 | 5.61 |
| U.S. Mid Cap Value | -15.72 | -12.86 | -12.86 | 5.42 | 3.88 |
| U.S. Small Cap Blend | -19.38 | -12.72 | -12.72 | 5.90 | 3.20 |
| Foreign Large Blend | -7.19 | -5.97 | -5.97 | 2.45 | 6.92 |
| U.S. Real Estate | -12.68 | -14.59 | -14.59 | 2.63 | 0.10 |
| Intermediate-term Bond | 0.87 | -0.50 | -0.50 | 2.15 | 2.27 |
**3-Year and 5-Year returns are average annual returns for that benchmark
Performance data presented reflects past performance. Past performance is no guarantee of future results. Investing involves risk, including loss of principal. Passive benchmarks are unmanaged groups of stocks and are not directly available for investment. Information has been obtained from a source considered to be reliable; however, neither First Affirmative nor its agents can guarantee the accuracy of the numbers reported.
Fixed Income Commentary
Provided by Wasmer Schroeder & Company
It Can Happen Just That Fast
In our business, it is often difficult to pinpoint exact events or moments in time where the world, or at least our markets, change on a dime. The fourth quarter, and for that matter all of 2018, were rolling along smoothly for the most part. The U.S. economy was humming along and was the envy of the developed world, and our friends at the Fed were busily and happily continuing their well telegraphed firming of domestic monetary policy. In response, stock prices were rising as were interest rates, but, as many pundits were saying, the latter for all of the ‘right’ reasons. Employment was strong, inflation was low, and consumer spending remained robust, and, despite some rather obvious signs of economic weakening evolving in other parts of the world, prognostications for the future were rosy. Then came November 9.
Why this specific date? That part is not as obvious. Sure, oil prices had been falling for a month, perhaps signaling falling global demand. The U.S. midterms were in the books a couple of days prior, but their gridlock inducing outcome had been priced into markets for several weeks. The Federal Open Market Committee meeting of the prior two days had come and gone as well with no policy, action and only a scant few wording changes to their communique. US rates were at their highs of this cycle, as 10-year yields briefly touched 3.25%, and all major equity indices were near all-time highs. The rest though, as we say, is history.
As oil prices fell through key support levels on their way much lower, sentiment began to shift, and then a litany of molehills began to turn into a mountain of worry: problems with Brexit, growing trade tensions with China, Defense Secretary Mattis’ resignation, the Mueller investigation, some rookie mistakes in Fed Chair Powell’s December FOMC messaging, and finally a partial government shutdown took turns buffeting the markets, and ‘risk-off’ became the mantra. In little more than seven chaotic, holiday-short-staffed-low-volume weeks, most of those higher rates had evaporated, 10-year yields were back below 2.70%, and the stock markets had surrendered all of their gains for the year and then some.
We now know that this mood and market action continued into January, only to be at least temporarily halted by the December jobs report, taking 10-years on an intraday basis briefly below 2.55%. While we certainly can wrap our arms around the reasons for this, in talking to other members of our investment team it does seem like this is something of an overreaction by market participants. Some of the recent data do seem to confirm some slowing of our economy, but this choppy pattern of economic improvement is nothing we haven’t seen before; we don’t think that a recession is on the horizon, nor that the FOMC, despite some recent softening of tone, will suddenly reverse their course of the last several years. Our base case remains for slightly higher rates this quarter, and for a still flatter yield curve over time. We will, however, as always, remain watchful and vigilant, because goodness knows things can always change in the blink of an eye.
Outlook
The fourth quarter was a battle between a fundamentally sound economy and a technically driven market. Obviously, the technicals won the battle of the fourth quarter, but the war is far from over. The growing economy led to higher tax receipts and increased revenues for companies. However, the reduction of liquidity and global growth concerns had investors de-risking. The price adjustments that occurred throughout the fourth quarter created attractive valuations in the marketplace. The question for investors has become; is the spread widening done or do we have more to go? We believe the volatility is likely here to stay despite a positive outlook for the economy next year, and we are most likely in a widening trend. That being said, there are still selective opportunities. The short-end of the corporate market looks like one of those opportunities. Investors receive relatively high all-in yields for taking on minimal spread duration risk. The anticipated flat yield curve environment also gives the mortgage basis a better outlook with fears over negative convexity reduced. As the fourth quarter reminded us, there is no replacement for high quality, longer duration assets in a rallying market. We believe investors should still be allocated there to provide protection, while taking advantage of credit and convexity in shorter segments of the yield curve.
Disclosure
The material provided is for informational purposes only and contains no investment advice or recommendations to buy or sell any specific securities. The statements contained herein are based upon the opinions of Wasmer, Schroeder & Company (WSC), the data available at the time of the presentation which may be subject to change depending on current market conditions. This presentation does not purport to be a complete overview of the topic stated, nor is it intended to be a complete discussion or analysis of the topic or securities discussed. All opinions and views constitute our judgments as of the date of writing and are subject to change at any time without notice. WSC does not accept any liability for any loss or damage arising out of the use of all or any part of this presentation. This report should not be regarded by recipients as a substitute for the exercise of their own judgment and may contain numerous assumptions. Different assumptions could result in materially different outcomes. Please contact Wasmer, Schroeder & Company for more complete information, including the implications and appropriateness of the strategy or securities discussed herein for any particular portfolio or client.
Wasmer, Schroeder & Company (WSC) is an investment advisor specializing in fixed income separate account portfolio management for high net worth individuals, wealth management groups and institutions, including foundations, banks, endowments and retirement plans. WSC has $8.89 billion in total assets under management as of 12/31/2018. The Firm works with advisors and clients to provide taxable and tax exempt fixed income portfolio solutions to meet their needs. The Firm’s corporate headquarters is in Naples, Florida, where the Tax Exempt Portfolio Management Team, Research, Client Services, Operations, IT, Accounting, Administration, Compliance, Communications & Data Analytics are located. Our Taxable Portfolio Management Team is located in Cleveland, Ohio. Client Relationship offices are located in Exton (Philadelphia area), Pennsylvania; New York, New York; and Portland, Oregon.
NOTE: Indexes are not available for direct investment. Mention of a specific company or security is not a recommendation to buy or sell that security. Past performance is never a guarantee of future results.