Mixed signals: New Highs, Decelerating Earnings Growth, Stretched Valuations
By Theresa Gusman
- US equities continue to hit new highs. The S&P 500 posted its best first half in 22 years, rising 18.5% through the end of June.
- Stock markets advanced worldwide, with developed and emerging international markets up 14.0% and 10.6%, respectively, year-to-date, and 3.7% and 0.6% in the second quarter.
- Volatility persisted during the quarter, with global equity markets rising and falling along with trade tensions — until it became apparent that the Federal Reserve would be quick to reduce rates amid slowing economic activity and continued low inflation.
- Fresh highs come amid slowing global growth, sharply decelerating earnings growth and stretched valuations.
Quarterly Performance Benchmarks
| Passive Benchmarks* | Q2-2019 | YTD | 1 Year | 3 Year** | 5 Year** |
| S&P 500 Index | 4.30 | 18.54 | 10.42 | 14.19 | 10.71 |
| MSCI KLD 400 Social Index | 3.95 | 18.37 | 9.80 | 13.77 | 9.85 |
| DJIA (reinvested dividends) | 3.21 | 15.40 | 12.20 | 16.80 | 12.29 |
| S&P MidCap 400 | 3.05 | 17.97 | 1.36 | 10.90 | 8.02 |
| Russell 2000 (Small Cap) | 2.10 | 16.98 | -3.31 | 12.30 | 7.06 |
| MSCI EAFE (Europe, Australasia, Far East) | 3.68 | 14.03 | 1.08 | 9.11 | 2.25 |
| MSCI Emerging Markets | 0.61 | 10.58 | 1.21 | 10.66 | 2.49 |
| Bloomberg Barclays Aggregate Bond | 3.08 | 6.11 | 7.87 | 2.31 | 2.95 |
| Morningstar Mutual Fund Benchmarks | Q2-2019 | YTD | 1 Year | 3 Year** | 5 Year** |
| U.S. Large Cap Growth | 4.63 | 21.11 | 10.02 | 16.97 | 11.33 |
| U.S. Large Cap Value | 3.02 | 14.59 | 5.79 | 10.12 | 6.84 |
| U.S. Mid Cap Growth | 5.61 | 24.97 | 9.88 | 15.59 | 9.78 |
| U.S. Mid Cap Value | 2.52 | 15.80 | 0.25 | 8.73 | 5.57 |
| U.S. Small Cap Blend | 2.21 | 15.74 | -3.76 | 10.09 | 5.65 |
| Foreign Large Blend | 1.93 | 18.33 | 10.45 | 4.66 | 7.23 |
| U.S. Real Estate | 2.97 | 13.58 | -0.06 | 8.13 | 2.03 |
| Intermediate-term Bond | 2.83 | 5.77 | 7.24 | 2.09 | 2.55 |
**3-Year and 5-Year returns are average annual returns for that benchmark
Performance data presented reflects past performance. Past performance is no guarantee of future results. Investing involves risk, including loss of principal. Passive benchmarks are unmanaged groups of stocks and are not directly available for investment. Information has been obtained from a source considered to be reliable; however, neither First Affirmative nor its agents can guarantee the accuracy of the numbers reported.
Global Market Highlights
- Following a 13.7% increase in the first quarter, the S&P 500 rose 4.3% in the second quarter and has since tacked on 2.5% (as of July 12th). Growth continued to outperform value in the second quarter: As reported by Morningstar, among US Funds, mid- (+5.6%), large- (+4.6%), and small-cap growth stocks (+4.1%) performed best in the quarter. Small value – which was up just 0.6% — was the worst performing US Fund category.
- From a sector perspective, second quarter performance was the mirror image of the first quarter – with gains in the “winners” more muted. The precious metals (+10.0%), financial (+6.5%), and industrials Morningstar Sector Equity categories were the top performers. Energy (-5.3%), natural resources ((+0.3%), and real estate (+0.5%) were at the bottom of the list.
- International equity performance was mixed during the quarter, with the vagaries of US trade discussions driving performance. Latin America stock funds performed best (+7.6%) and China Region (-3.1%), India (-1.3%), and Japan (-0.1%) were the worst performers.
- The reversal in progress on US-China trade talks early in the quarter sent energy (-4.6%) and industrial metals (-7.2%) prices lower, and corn (+14.9%) and wheat (+14.0%) prices rose as rain soaked the US mid-west.
Outlook – Climbing a wall of worry…Until we get to the top
On the plus side, global economies and corporate earnings continue to grow, inflation remains in check, and interest rates are set to fall in the US, Europe, and emerging markets. On the minus side, economic and earnings growth are decelerating, equity valuations are stretched, and more negative EPS pre-announcements have been issued heading into the second quarter than in any quarter since FactSet began tracking the data in 2006. The data points to a market decline. However, equity markets are telling us investors believe Central Banks have the wherewithal to save the day. In fact, according to FactSet, after the recent record close, analysts still predict an 8.3% increase in the value for the S&P 500 over the next 12-months.
US economic growth is decelerating, and indicators of future business activity point toward further slowing. Europe and Japan remain anemic, and Brexit and ongoing social unrest remain wildcards. And Chinese GDP growth has weakened to 6.2% in the second quarter, its lowest since the 1990s. Despite the resumption of US-China trade negotiations, there is no certainty that a deal will be reached in time to prevent further economic damage.
The market’s fundamental underpinnings continue to deteriorate, and valuations generally are above (in some cases, well-above) the mid-point of their 10-year range. As a result, we believe allocation across sectors, industries, and individual stocks (also known as active management) will play a larger role in investment outcomes in the coming quarters. In the end, markets will continue to climb a “wall of worry”, until we reach a too-difficult-to-predict tipping point. We anticipate modest equity returns amid higher volatility, to both the downside and the upside.
Earnings growth continues to decelerate
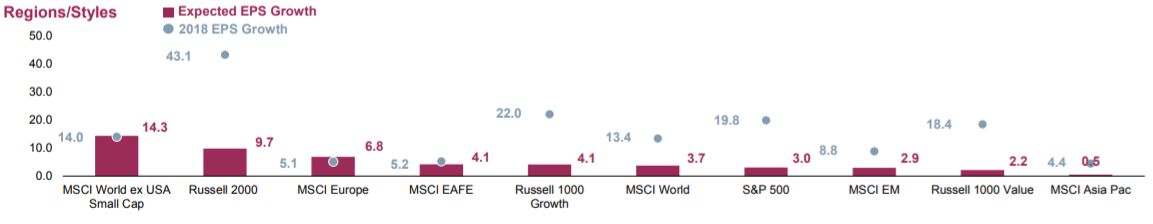
Against the backdrop of a slowing US economy, the fading benefits of the US corporate tax cut, and continuing sluggishness internationally, we anticipate a significant deceleration in the pace of US earnings growth over the next several quarters. In fact, FactSet’s tabulation of bottom-up earnings projections points toward a dramatic decline in the rate of S&P 500 earnings growth to 2.6% (down from a 4.3% forecast in the first quarter) in 2019 from 19.8% in 2018. Only Europe – which saw comparatively sluggish 5.1% earnings growth in 2018 – may see an acceleration in earnings growth in 2019 (see Figure 1).
Figure 1.

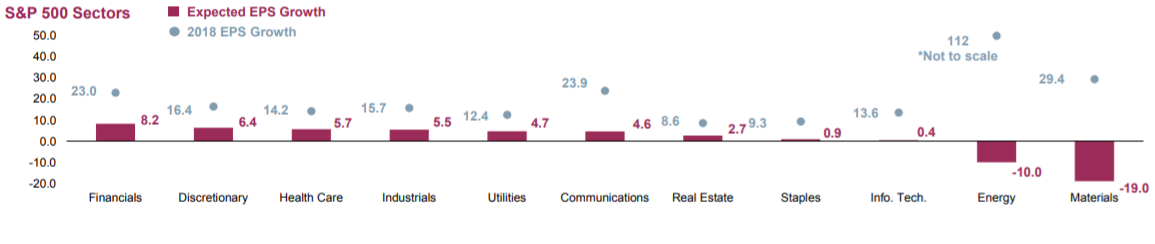
In the US, corporate earnings growth is expected to fall sharply across all S&P 500 sectors (see Figure 2) in 2019. Earnings declines of 19.0% and 10.0% are forecast for the Materials and Energy sectors, respectively, and the high-flying Information Technology sectors is poised for a paltry 0.4% earnings gain. The Financials (+8.2%), Discretionary Source: Factset as of 6/30/19. Expected EPS Growth is the % change in EPS growth from the beginning of the current calendar year through the end of the calendar year. 2018 EPS Growth is the % change in EPS from the beginning of the year through the end of the year. Figure 1. Corporate Earnings Growth, Regions/ Styles (6/30/19) (+6.4%), and Health Care (+5.7%) sectors are set for the largest earnings increases in 2019.
Figure 2.
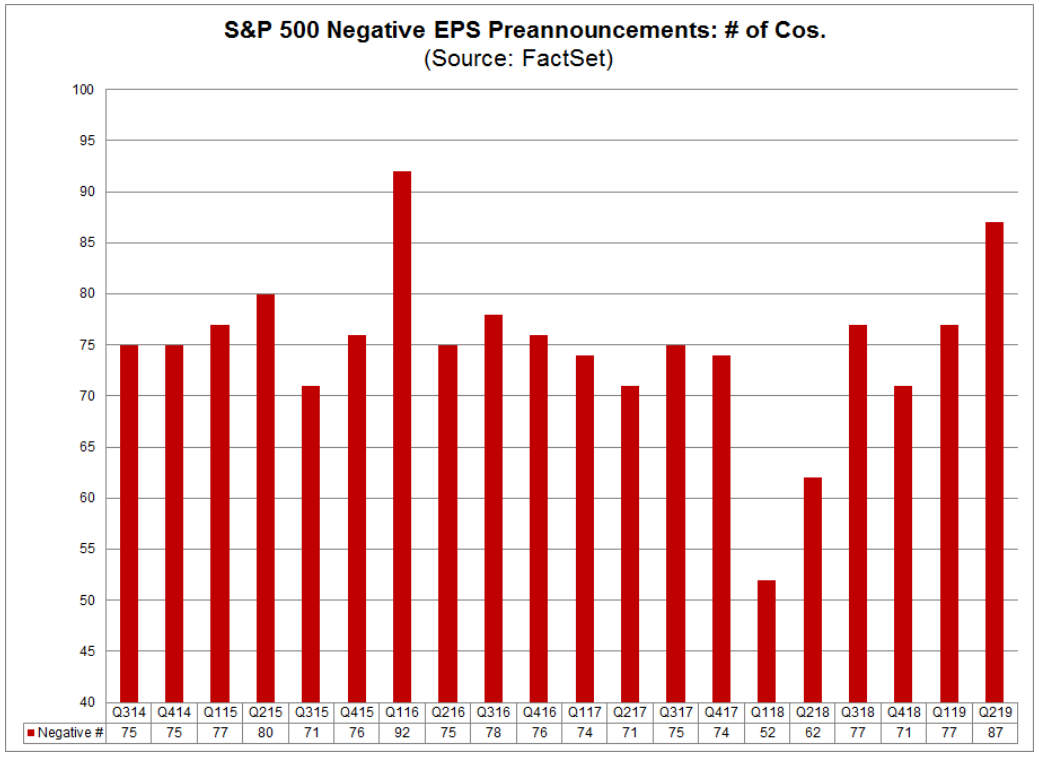
Continuing a lackluster year, second quarter earnings are set to decline by 3.8% year over year. Just as forecasts lagged reality on the upside, we anticipate “negative earnings surprises” as companies and analysts scurry to catch up with deteriorating momentum over the next several quarters. This trend became apparent heading into the end of the second quarter. The number of S&P 500 companies issuing negative EPS guidance through the end of June totaled 87, which – if it is the final number for the second quarter – will be the highest number of companies issuing negative EPS guidance since FactSet began tracking this data in 2006 (see Figure 3).
Figure 3.
Valuations at or above historic averages
The first half surge in equities leaves valuations at or above historic averages. The valuation of the Russell 1000 Growth index is most stretched, with a Next-TwelveMonth (NTM) Price/Earnings Ratio (P/E) of 20.9, near the historic average of 21.4. The S&P 500, MSCI World, MSCI Emerging Markets, and MSCI Europe indices are also above their historic averages. The Russell 2000, Russell 1000 Value, MSCI World Ex-USA Small Cap, and MSCI EAFE are in line with their history averages. Importantly none of the indices are below their historic averages.
From a sector perspective, Consumer Discretionary, Information Technology, and Utilities are most over– stretched from a valuation perspective. Only the energy sector, which will show an earnings decline in 2019, is trading below its 10-year average NTM P/E.
We anticipate continued volatility and mixed, choppy returns across stocks, sectors and geographies amid the reality of stretched valuations reduced earnings expectations in the coming months. However, barring an economic recession, we are looking for modest overall gains in equity markets through 2019.
Achieving Long-Term Investment and Impact Objectives
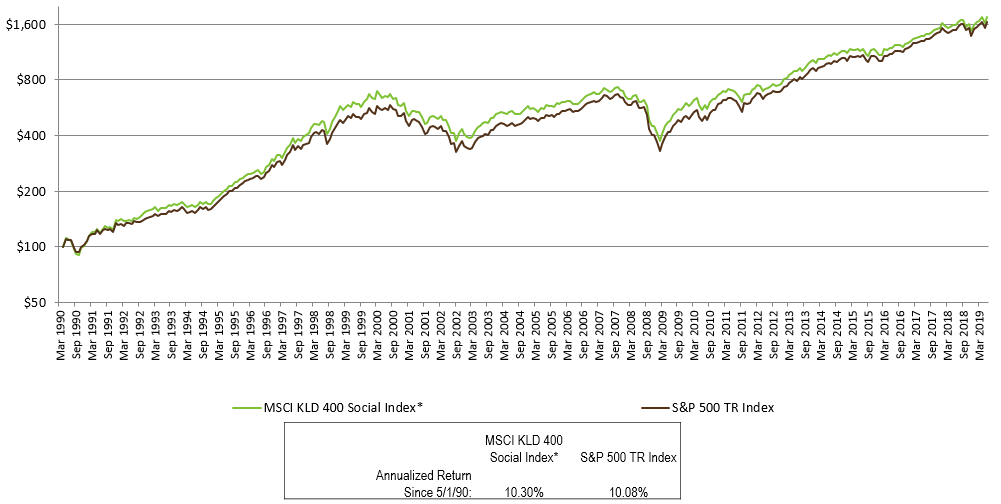
As shown in Figure 4, the MSCI KLD 400 index continues to track the S&P 500 index. The sustained, consistent performance of this standard SRI benchmark supports our view that sustainable, responsible, and impact investing and mainstream financial returns are not mutually exclusive.
As always, everything we do at First Affirmative is driven by our dedication to enabling advisors to deliver financial results to clients and belief in the power of capital to bring about lasting environmental and social change. Our three Sustainable Investment Solutions – Custom, Multi-Manager, and Managed Mutual Fund – are built to enable clients to achieve their financial goals over the long term, along with their individual environmental, social, governance, ethical, and values-based objectives. Each portfolio is carefully constructed to be well diversified across assets, sectors, geographies, securities, and management styles –– and designed to weather periods of uncertainty and volatility.
Quarterly Bond Market Overview
Provided by Wasmer Schroeder
To Xi or not to Xi?
With all due credit to Shakespeare, there is no doubt that the very fluid state of the United States’ trading policies and practices with China and other major partners drove both asset price movement and market sentiment in the second quarter, and it is continuing to do so as we head into the year’s third quarter. At times, this evolving, change-on-a-dime dynamic has been unsettling for the markets. It would be less troublesome, however, if it were, indeed, THE question. Unfortunately, many other questions from around the globe will also need to be answered in the coming months, such as: Hard, soft, or no Brexit? Who will be the new British Prime Minister? How will Italy’s elections affect the euro and the country’s relationship with much of Europe, especially given Italy’s economic woes and staggering debt load? How much political uncertainty will the unfolding 2020 US Presidential election cycle create? Can the President and the Chinese Premier ultimately hammer out a trade compromise? And, perhaps most importantly for the bond markets, will we see further global monetary policy accommodations??
What makes this an interesting, albeit unusually difficult time for those of us who try to forecast rates, spreads, and other determinants of bond market performance, is the one common thread these questions share: while their emerging answers may shape fundamentals, they are not, at their core, fundamental economic issues. Rather, they are mainly political or geopolitical issues that are dependent on the statements, decisions, and actions of people and groups. Further, some of these decision makers tend to be fickle and/or impulsive, which leads to an added amount of market volatility in all different directions, especially given the speed with which news travels today.
As mentioned above, however, the most pressing question to us is the course of domestic monetary policy over the rest of this year. Clearly, as of this writing, the markets are both insisting on and anticipating a cut in the Fed Funds target to be made at the Federal Open Market Committee’s upcoming, July 30-31 meeting. Certainly, as we have believed would be the case for some time, the inflation picture gives the Fed not just cover but almost a need to cut rates, as price increases continue to run below target. The rest of the US data paints a much more complicated picture. While second quarter growth is appearing to clearly lag the first quarter’s solid 3.1% rate, it should still comfortably be in the 2% range. Employment remains strong, and most other metrics paint a picture of a US economy that is still healthy, even if it has slowed at the margin. That said, the markets are pricing in not only a 100% chance of a 25 basis point cut but a one-in-five chance of a 50 basis point move, which we think is overly aggressive. Such a move would undoubtedly warm the hearts of risk traders; however, we think this would limit the Fed’s flexibility should we actually get into a recessionary environment. Therefore, we think 50 basis points is neither in the cards nor is necessary. We believe instead that rates will be relatively range-bound this quarter, the curve may actually resume some modest flattening as the Fed takes a measured approach, and that risk, in the form of spreads, We believe instead that rates will be relatively range-bound this quarter, the curve may actually resume some modest flattening as the Fed takes a measured approach, and that risk, in the form of spreads, will remain well bid if not occasionally volatile. This phenomenon of lower yields and lower spreads at the same time, a relatively unusual occurrence, will probably continue as both the global economy and global monetary policy hit tipping points.
Disclosure
The material provided is for informational purposes only and contains no investment advice or recommendations to buy or sell any specific securities. The statements contained herein are based upon the opinions of Wasmer, Schroeder & Company (WSC), the data available at the time of the presentation which may be subject to change depending on current market conditions. This presentation does not purport to be a complete overview of the topic stated, nor is it intended to be a complete discussion or analysis of the topic or securities discussed. All opinions and views constitute our judgments as of the date of writing and are subject to change at any time without notice. WSC does not accept any liability for any loss or damage arising out of the use of all or any part of this presentation. This report should not be regarded by recipients as a substitute for the exercise of their own judgment and may contain numerous assumptions. Different assumptions could result in materially different outcomes. Please contact Wasmer, Schroeder & Company for more complete information, including the implications and appropriateness of the strategy or securities discussed herein for any particular portfolio or client.
Wasmer, Schroeder & Company (WSC) is an investment advisor specializing in fixed income separate account portfolio management for high net worth individuals, wealth management groups and institutions, including foundations, banks, endowments and retirement plans. WSC has $8.89 billion in total assets under management as of 12/31/2018. The Firm works with advisors and clients to provide taxable and tax exempt fixed income portfolio solutions to meet their needs. The Firm’s corporate headquarters is in Naples, Florida, where the Tax Exempt Portfolio Management Team, Research, Client Services, Operations, IT, Accounting, Administration, Compliance, Communications & Data Analytics are located. Our Taxable Portfolio Management Team is located in Cleveland, Ohio. Client Relationship offices are located in Exton (Philadelphia area), Pennsylvania; New York, New York; and Portland, Oregon.
NOTE: Indexes are not available for direct investment. Mention of a specific company or security is not a recommendation to buy or sell that security. Past performance is never a guarantee of future results.