Volatility reigns: It just feels better on the upside
By Theresa Gusman
- Volatility reigned in the first quarter. The US stocks surged higher, posting their best quarter in nearly a decade and offsetting the fourth quarter downdraft.
- Equity markets rebounded worldwide led by China, as US-China trade tensions eased, and the Fed signaled that it is unlikely to raise rates in 2019.
- The first quarter was the mirror image of the fourth. Growth stocks outperformed value, small outperformed large, economically sensitive sectors topped the performance charts, oil prices rebounded, and China was the top performing market in the world.
- We remain convinced that the fourth quarter ushered in a period of equity market volatility (which always feels better on the upside), asynchronous and decelerating global economic and profit growth, and negative earnings surprises.
Outlook — Modest Equity Returns Amid Higher Volatility
We did not anticipate that progress toward a US-China accord would accelerate in the first quarter, or (perhaps more importantly) the Fed would put interest rate increases on hold for the remainder of 2019. Farmers, manufacturers, and consumers may benefit from the former, and the housing sector – which was weakening precipitously as we entered 2019 – may benefit from the latter. The US economy remains strong , unemployment is exceptionally low, and wages are rising, particularly for low- and middle-income workers. However, economic growth is past its peak and indicators of future business activity are slowing.
Internationally, economic activity remains sluggish, especially in Europe, and Brexit and intermittent social unrest present wildcards. Emerging markets continue to feel the pinch of slower global growth; however, if a trade agreement is struck with the US, the Chinese economy has the potential to rev up, lifting commodity prices and potentially other commodity-heavy emerging markets.
Against this backdrop – and particularly in the wake of the first quarter surge – we anticipate modest equity returns amid higher volatility, to both the downside and the upside. The market’s fundamental underpinnings continue to deteriorate, and valuations generally are at the mid-point of their 10-year range. As a result, we believe allocation across sectors, industries, and individual stocks (also known as active management) will play a larger role in investment outcomes in the coming quarters.
Earnings Growth to Decelerate
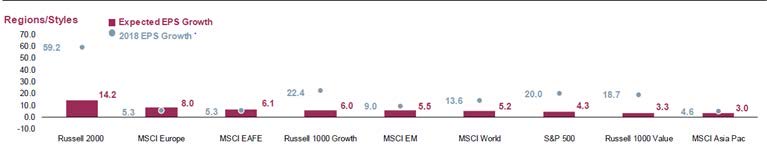
Against the backdrop of a slowing US economy, the fading benefits of the US corporate tax cut, and continuing sluggishness internationally, we anticipate a significant deceleration in the pace of earnings growth over the next several quarters. In fact, Factset’s tabulation of bottom-up earnings projections points toward a dramatic decline in the rate of S&P 500 earnings growth to 4.3% in 2019 from 20.0% in 2018. Only Europe – which saw comparatively sluggish 5.3% earnings growth in 2018 – may see an acceleration in earnings growth in 2019 (see Figure 1.)
Figure 1.
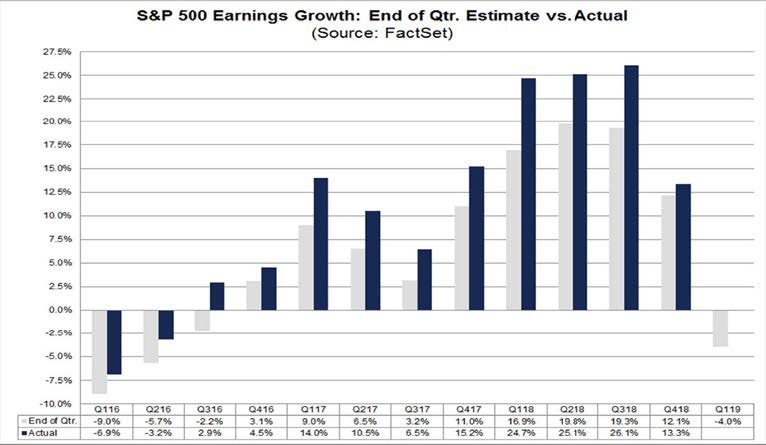
Although we would like to believe the magnitude of the likely earnings deterioration has been captured in next 12-month EPS forecasts, we do not. In our experience, earnings surprises are like cockroaches: there’s never only one. According to Factset, over the past five years, actual earnings reported by S&P 500 companies have exceeded estimated earnings by 4.8%, on average. However, the pace of earnings “beats” slowed precipitously in the fourth quarter as earnings growth slowed (see Figure 2).
Figure 2.

Kicking off a lackluster year, first quarter earnings are set to decline by 4.0% year over year. Just as forecasts lagged reality on the upside, we anticipate “negative earnings surprises” as companies and analysts scurry to catch up with deteriorating momentum over the next several quarters. Interestingly, with the predictable roll-off of the earnings benefits of US corporate tax cuts, the magnitude of negative earnings surprises associated with the current loss of economic momentum might be more muted than previous periods.
Valuations Near Historic Averages…With a Notable Exception
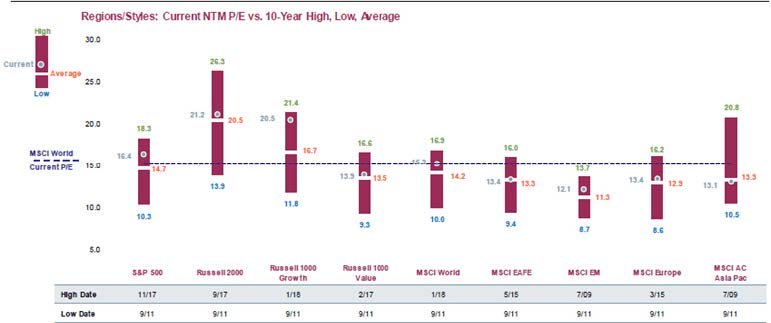
After the fourth quarter downdraft in global equity markets slashed valuations to below 10-year average PE ratios, the first quarter rebound moved valuations to near-parity. Near-parity, that is, with the notable exception of the Russell 1000 Growth index, which is approaching its peak valuation (see Figure 3). Similarly, most S&P 500 sectors are near the mid-points of their 10-year average NTM P/Es – except the Information Technology sector, which is nearing its high.
Although we would like to believe the magnitude of the likely earnings deterioration has been captured in next 12-month EPS forecasts, we do not. In our experience, earnings surprises are like cockroaches – there’s never only one. In fact, according to Factset, over the past five years, actual earnings reported by S&P 500 companies have exceeded estimated earnings by 4.8%, on average — and by significantly more in recent quarters — as earnings growth accelerated (see figure 3). Just as forecasts lagged reality on the upside, we anticipate “negative earnings surprises” as companies and analysts scurry to catch up with deteriorating momentum over the next several quarters. Interestingly, with the predictable roll-off of the earnings benefits of US corporate tax cuts, the magnitude of negative earnings surprises associated with the current loss of economic momentum might be more muted than previous periods.
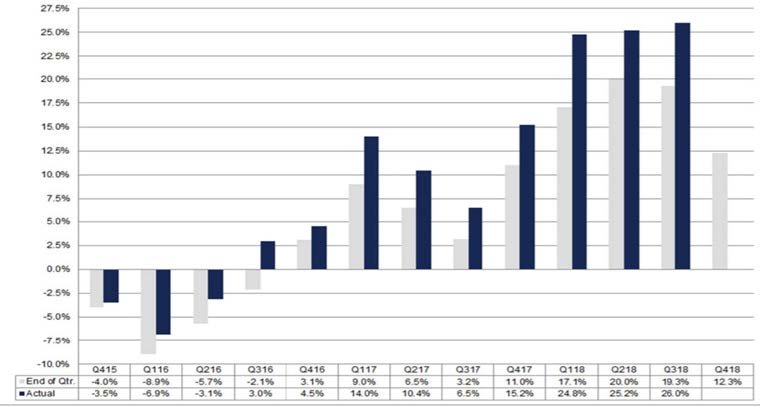
Figure 3. S&P 500 Earnings Growth: End of Quarter Estimate vs. Actual, Q415-Q418
Valuations at or Below Historic Averages
The fourth quarter downdraft in global equity markets reduced valuations to at or below 10-year average PE ratios – with the notable exception of the R1000 Growth index (see Figure 4). We anticipate continued volatility and mixed, choppy returns across stocks, sectors and geographies amid the reality of reduced earnings expectations in the coming months. However, barring an economic recession, we are looking for modest overall gains in equity markets in 2018.
We anticipate continued volatility and mixed, choppy returns across stocks, sectors and geographies amid the reality of reduced earnings expectations in the coming months. However, barring an economic recession, we are looking for modest overall gains in equity markets in 2018.
Achieving Long-Term Investment and Impact Objectives
The MSCI KLD 400 index continues to track the S&P 500 index. The sustained, consistent performance of this standard SRI benchmark supports our view that sustainable, responsible, and impact investing and mainstream financial returns are not mutually exclusive.
As always, everything we do at First Affirmative is driven by our dedication to enabling advisors to deliver financial results to clients and belief in the power of capital to bring about lasting environmental and social change. Our three Sustainable Investment Solutions – Custom, Multi-Manager, and Managed Mutual Fund – are built to enable clients to achieve their financial goals over the long term, along with their individual environmental, social, governance, ethical, and values-based objectives. Each portfolio is carefully constructed to be well diversified across assets, sectors, geographies, securities, and management styles –– and designed to weather periods of uncertainty and volatility.
Quarterly Performance Benchmarks
| Passive Benchmarks* | Q1 2019 | YTD | 1 Year | 3 Year** | 5 Year** |
| S&P 500 Index | 13.65 | 13.65 | 9.50 | 13.51 | 10.91 |
| MSCI KLD 400 Social Index | 13.88 | 13.88 | 9.53 | 12.75 | 9.96 |
| DJIA (reinvested dividends) | 11.81 | 11.81 | 10.09 | 16.37 | 12.21 |
| S&P MidCap 400 | 14.49 | 14.49 | 2.59 | 11.24 | 8.29 |
| Russell 2000 (Small Cap) | 14.58 | 14.58 | 2.05 | 12.92 | 7.05 |
| MSCI EAFE (Europe, Australasia, Far East) | 9.98 | 9.98 | -3.71 | 7.27 | 2.33 |
| MSCI Emerging Markets | 9.91 | 9.91 | -7.41 | 10.68 | 3.68 |
| Bloomberg Barclays Aggregate Bond | 2.94 | 2.94 | 4.48 | 2.03 | 2.74 |
| Morningstar Mutual Fund Benchmarks | Q1 2019 | YTD | 1 Year | 3 Year** | 5 Year** |
| U.S. Large Cap Growth | 15.67 | 15.67 | 10.71 | 15.35 | 11.26 |
| U.S. Large Cap Value | 11.29 | 11.29 | 4.48 | 10.01 | 7.20 |
| U.S. Mid Cap Growth | 18.19 | 18.19 | 8.04 | 14.18 | 8.99 |
| U.S. Mid Cap Value | 12.94 | 12.94 | 0.66 | 8.55 | 5.87 |
| U.S. Small Cap Blend | 13.34 | 13.34 | -0.03 | 10.17 | 5.62 |
| Foreign Large Blend | 16.14 | 16.14 | 17.08 | 6.00 | 8.29 |
| U.S. Real Estate | 10.24 | 10.24 | -5.00 | 6.62 | 2.10 |
| Intermediate-term Bond | 3.13 | 3.13 | 3.98 | 2.37 | 2.51 |
**3-Year and 5-Year returns are average annual returns for that benchmark
Performance data presented reflects past performance. Past performance is no guarantee of future results. Investing involves risk, including loss of principal. Passive benchmarks are unmanaged groups of stocks and are not directly available for investment. Information has been obtained from a source considered to be reliable; however, neither First Affirmative nor its agents can guarantee the accuracy of the numbers reported.
Fixed Income Commentary
Provided by Wasmer Schroeder & Company
Overview
The muni train kept a rollin’ during 1Q 2019 as the market wrapped up its fifth consecutive month of positive performance in March and its best quarter from a total return standpoint since 1Q 2014. Lower US Treasury yields and strong supply/demand technical factors were overwhelmingly supportive of municipal bond prices during the quarter. The Bloomberg Barclays Municipal Bond Index posted a total return of +2.90% for the quarter, outperforming the US TreasuryIndex by 79 basis points(bps).
Muni-to-Treasury Ratios
The record investor inflows during the quarter led to tighter muni-to-Treasury yield ratios along the curve. Ratios on bonds maturing inside of five years fell below 70%, while 10-year ratios fell to their lowest levels (78%) since Bloomberg began tracking the data in 2001. The long end of the curve, which sat out the rally for most of 2018 due to lower participation (and outright selling) from insurance companies and banks, finally got the attention it deserved—30-year ratios fell from 102% at the end of 2018 to close out the quarter at 96%. The lower ratios we are seeing today are not so much a problem for muni investors than they are just a symptom of the strong technical influences than we outlined above. The ultimate impact, if and when these ratios correct to levels considered to be more “normal” by historical standards, will likely be just a period of short-term underperformance for the municipal market versus the Treasury market.
Looking Forward
We expect technical factors to remain a wildcard for the muni market during 2Q 2019. While investor demand for tax exempt bonds should remain strong, inflows could slow from the blistering pace set during the first quarter of 2019. Meanwhile, supply has been tight year-to-date, but we are expecting to see a seasonal increase over the coming months. The net effect will likely be a normalization of muni-to-Treasury ratios, particularly in the 5-10 year area of the curve. From a valuation standpoint, credit trends appear supportive of current market levels, and we believe that taxable equivalent yields on ‘A’ and ‘BBB’ rated bonds will continue to entice investors looking to enhance their portfolio yields. We also think that the Treasury market will continue to dictate the overall direction of yields. For investors that have engaged in a shorter-duration bias, it will be important to monitor the trend in short yields and to determine what that means for reinvestment risk.
Disclosure
The material provided is for informational purposes only and contains no investment advice or recommendations to buy or sell any specific securities. The statements contained herein are based upon the opinions of Wasmer, Schroeder & Company (WSC), the data available at the time of the presentation which may be subject to change depending on current market conditions. This presentation does not purport to be a complete overview of the topic stated, nor is it intended to be a complete discussion or analysis of the topic or securities discussed. All opinions and views constitute our judgments as of the date of writing and are subject to change at any time without notice. WSC does not accept any liability for any loss or damage arising out of the use of all or any part of this presentation. This report should not be regarded by recipients as a substitute for the exercise of their own judgment and may contain numerous assumptions. Different assumptions could result in materially different outcomes. Please contact Wasmer, Schroeder & Company for more complete information, including the implications and appropriateness of the strategy or securities discussed herein for any particular portfolio or client.
Wasmer, Schroeder & Company (WSC) is an investment advisor specializing in fixed income separate account portfolio management for high net worth individuals, wealth management groups and institutions, including foundations, banks, endowments and retirement plans. WSC has $8.89 billion in total assets under management as of 12/31/2018. The Firm works with advisors and clients to provide taxable and tax exempt fixed income portfolio solutions to meet their needs. The Firm’s corporate headquarters is in Naples, Florida, where the Tax Exempt Portfolio Management Team, Research, Client Services, Operations, IT, Accounting, Administration, Compliance, Communications & Data Analytics are located. Our Taxable Portfolio Management Team is located in Cleveland, Ohio. Client Relationship offices are located in Exton (Philadelphia area), Pennsylvania; New York, New York; and Portland, Oregon.
NOTE: Indexes are not available for direct investment. Mention of a specific company or security is not a recommendation to buy or sell that security. Past performance is never a guarantee of future results.