Endemic COVID + Higher Inflation = New Normal
Overview
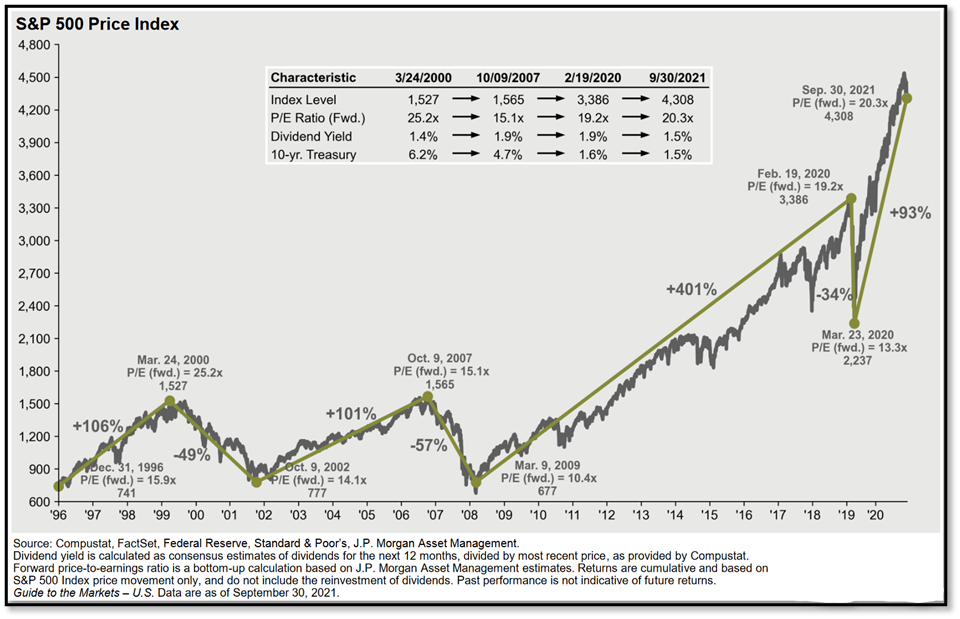
At third quarter end, the S&P 500 was 93% above its March 23, 2020, pandemic low and 27% above its pre-pandemic high (see Figure 1). As we move through the fourth quarter, COVID is transitioning from pandemic to endemic, inflation is accelerating amid labor shortages, kinks in the supply chain, and the global push toward a lower carbon economy, and gridlock has re-emerged in Washington. Against this backdrop, as evidenced by third quarter results, earnings growth will be the key determinant of stock price performance.
Figure 1. S&P 500 at Inflection Points – Bull and Bear Markets, 1996 to Date
Third Quarter Market Review
Global equities paused in the third quarter, with the return for the year holding steady at +12.3% (see Figure 2). US stocks (S&P 500 +0.2%) outperformed non-US stocks (MSCI ACWI Ex-USA -3.2%), with emerging markets lagging developed markets. Large cap stocks outperformed small, and growth stocks outperformed
value (see Figure 3) for the second consecutive quarter. The Barclays Aggregate Bond index fell 1.6% in the third quarter and remains underwater for the year.
Finally, commodities remained the stand-out performers in the third quarter. For the year-to-date, Energy, Industrial Metals, and Agriculture are higher. Higher commodity prices reflect the acceleration in economic activity, inventory rebuilding, and supply constraints.
Figure 2. Global Equity, Fixed Income, and Real Assets Performance (Percent Change), 3Q 2021
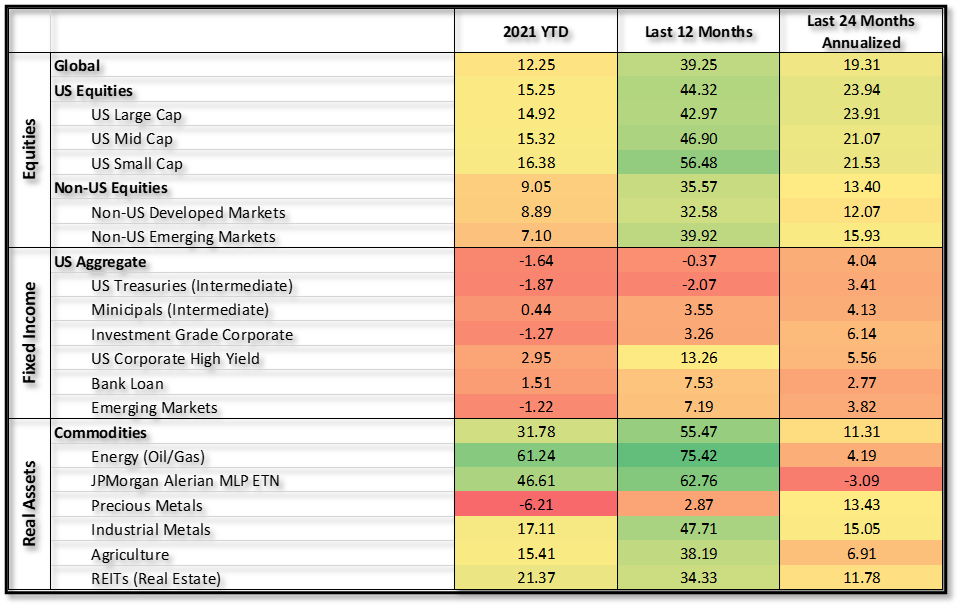
Note: Coloring is relative. Deeper green indicates higher relative return, deeper red indications lower relative return.
Figure 3. Morningstar Style Box Analysis, 3Q 2021
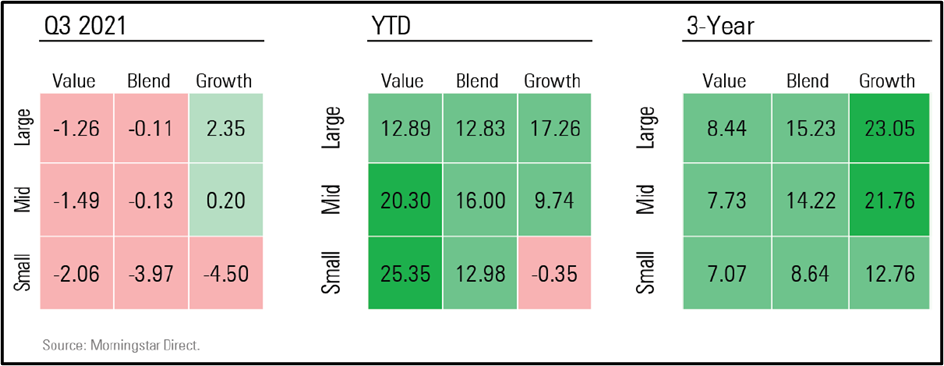
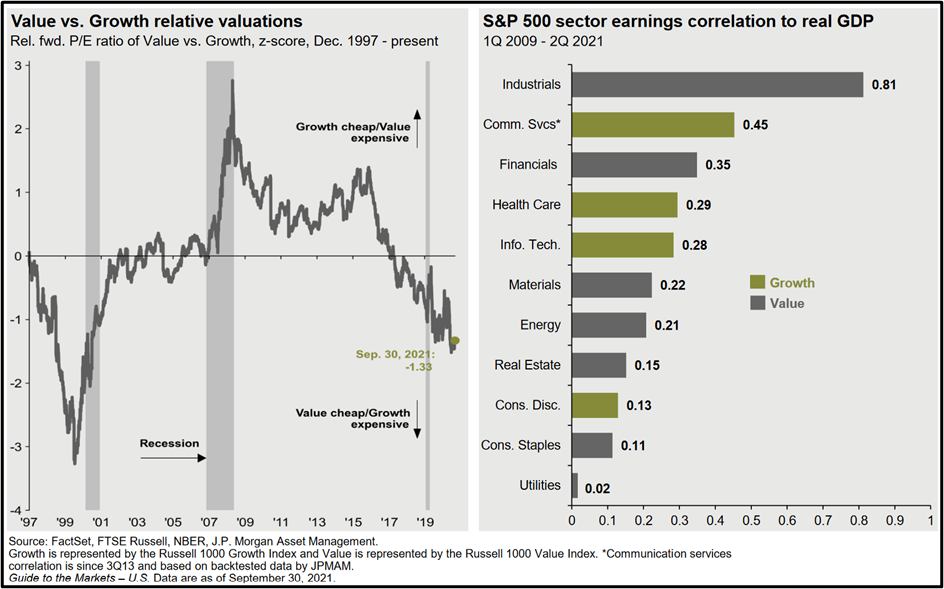
Notwithstanding the recent reversal, the longer-term performance gap, current valuations, and the economic backdrop continue to favor the economically sensitive sectors represented in the value category (see Figure 4).
Figure 4. Value versus Growth and Sector Earnings Correlation to Real GDP, 3Q 2021
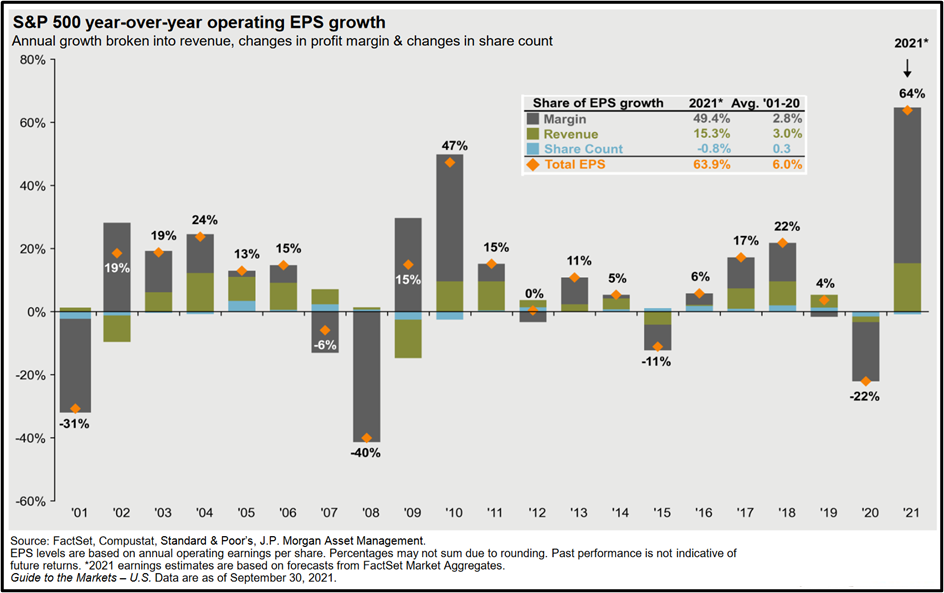
Equity markets are expensive, which is “normal” for this early stage of an economic recovery. However, corporate profits are set to recover sharply through 2022, continuing the pattern established in the first three quarters of this year. Just as we saw estimates chasing reported earnings downward in 2020, we are seeing the reverse this year. This is particularly true in Energy, Industrials, Consumer Discretionary, and Materials, which took the brunt of the decline during the pandemic. Both revenues and margins are set to expand rapidly in 2021 (see Figure 5). With inflation accelerating pricing power will become increasingly important in 2022. Industries able to pass on raw material and labor cost increases and those able to quickly implement technology changes to improve efficiency will fare far better than those unable to do so.
Figure 5. S&P 500 Earnings Growth, 2001-2021
Outlook – Endemic COVID + Higher Inflation
The historic bull market continues. However, investors should prepare for choppiness and possible consolidation as COVID moves – possibly in “fits and starts” – from pandemic to endemic and an inflation regime change leads us to dust off playbooks buried since the 1970s. Investors who stay the course amid market volatility and conflicting prognostications, maintaining well-diversified portfolios geared toward achieving their long-term objectives, will continue to be rewarded.
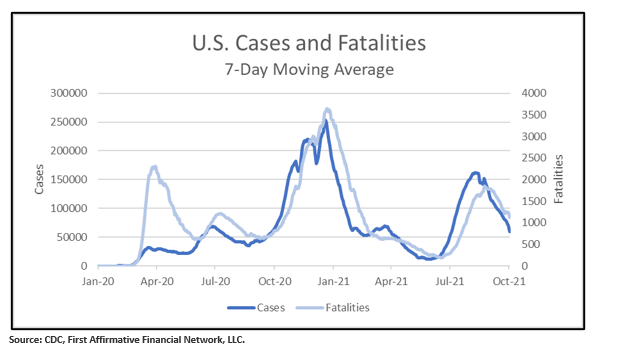
Following a summer surge, the number of COVID cases has fallen sharply (see Figure 6). As a result, the COVID pandemic appears to be moving toward endemic status – with the likelihood of ups and downs more akin to the flu. Immunity resulting from natural infection and vaccines, altered patterns of social contact, and reduced virus transmissibility are contributing to progress toward a new normal, which will look more like the pre-pandemic normal than the March 2020 to date period.
Figure 6. New COVID Cases in the US – Virus Inception to October 21, 2021
Steady monetary policy and persistent fiscal stimulus bode well for equity markets. However, against this monetary and fiscal backdrop – combined with labor shortages, kinks in the supply chain, and the global push toward a lower carbon economy – we are likely in the early stages of an inflation “regime change”.
As inflation heats up, we found these charts from JP Morgan Asset Management interesting.
- Figure 7 puts the current inflation surge in a historical context. It shows that the current surge leaves most metrics above their 50-year average and the Energy CPI at nearly 5 times its 50-year average.
- Figure 8 shows nominal and real yields on 10-year US treasuries. At -2.46% on September 30, 2021, real yields are at a level last seen when nominal yields peaked at 15.84% on September 30, 1981. It would appear that “something has to give”. Either nominal rates will rise to reflect the surge in inflation, or inflation will retreat, confirming that it is transitory (which seems to be what the bond market is telling us).
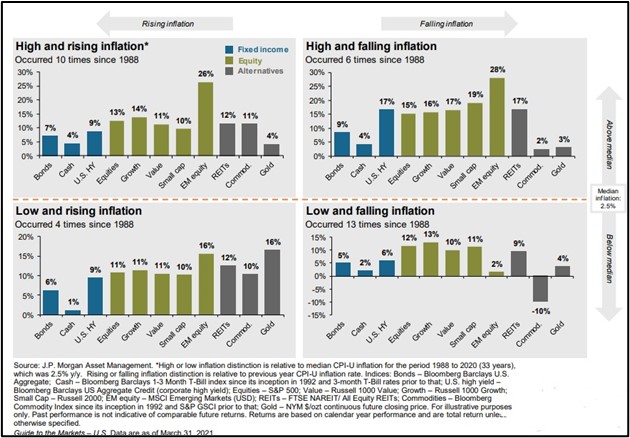
- Finally, Figure 9 looks at asset class performance in different inflation environments over the past 33 years. It shows that as inflation moves from pre-pandemic “low (less than 2.5%) and falling” levels to today’s “low and rising” to “high and rising” – likely where we are going – emerging markets and real asset could move higher continue to outperform.
Figure 7. US Inflation Measurements, 1971-August 2021
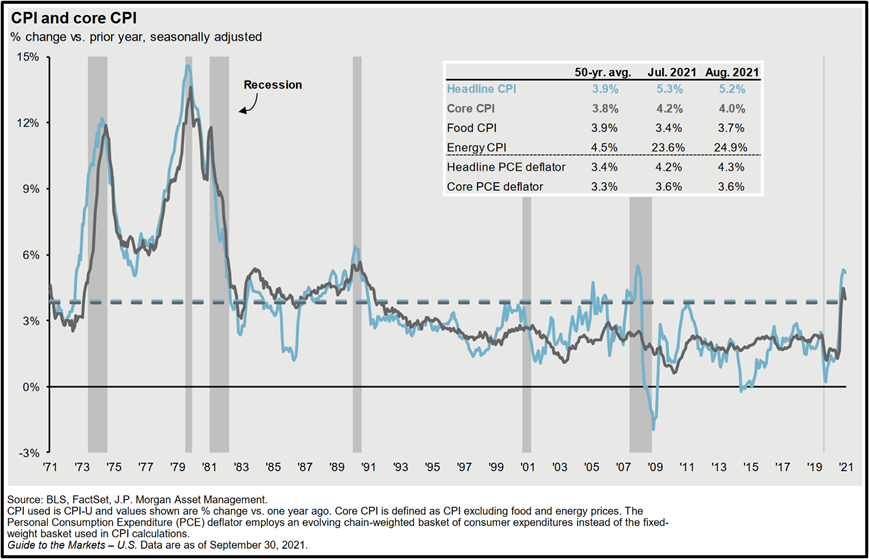
Figure 8. Nominal and Real 10-Year Treasury Yields, 1958-September 30, 2021
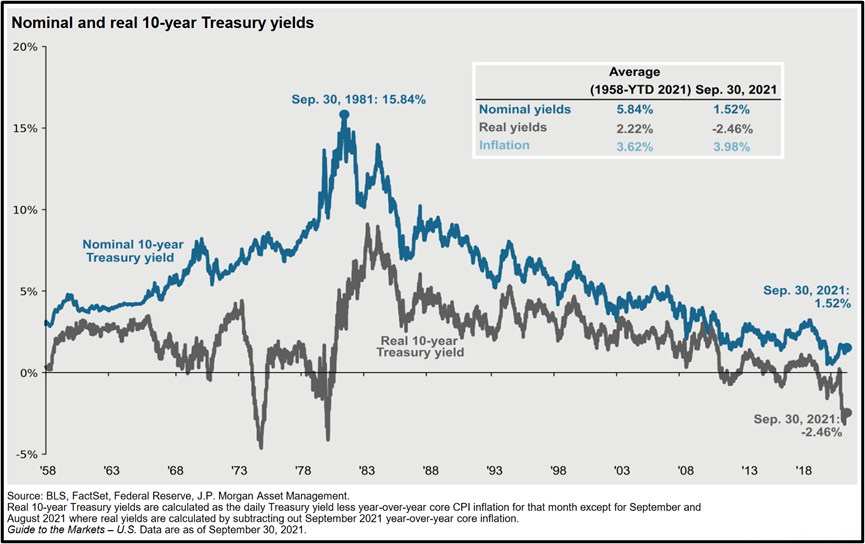
Figure 9. Fixed Income, Equity, and Alternatives Returns in Different Inflation Environments
Achieving Long-Term Investment and Impact Objectives
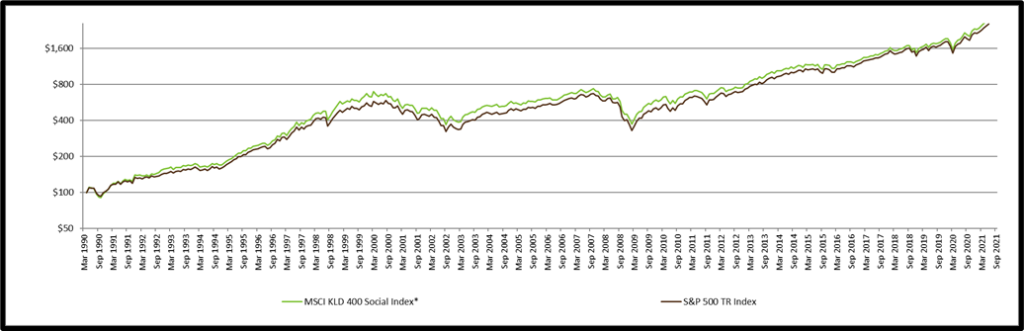
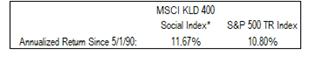
The shift into sustainable, responsible, and impact (SRI) investments continues. According to Morningstar, sustainable fund assets hit a record $3.9 trillion at third quarter end. As shown in Figure 10, the MSCI KLD 400 index outperformed the S&P 500 index year to date, as it has over the long term. The sustained, consistent performance of this standard SRI/ESG benchmark over time and recent outperformance support our view that strategies incorporating environmental, social and governance (ESG) factors – with an eye toward making the world a better place – and mainstream financial returns can be achieved simultaneously.
As always, everything we do at First Affirmative is driven by our dedication to enabling advisors to deliver financial results to clients and belief in the power of capital to bring about lasting environmental and social change. Our three Sustainable Investment Solutions – Custom Direct Index, Multi-Manager, and Managed Mutual Fund – are built to enable clients to achieve their financial goals over the long term, along with their individual environmental, social, governance, ethical, and values-based objectives. Each portfolio is carefully constructed to be well diversified across assets, sectors, geographies, securities, and management styles –– and designed to weather periods of uncertainty and volatility.
Figure 10. MSCI KLD 400 vs S&P 500 Indices, September 30, 2021