
Earnings and Economic Growth Decelerating, Valuations Stretched – Markets Rising?
By Theresa Gusman, Chief Investment Officer | Download PDF
- US equities continue to hit new highs. After its best first half in 22 years, the S&P 500 posted a 1.7% gain in the third quarter.
- Global equity markets were mixed. Japanese, European and US equities rose in the third quarter, while non-Japan Asia and Emerging Markets declined, paring gains for the year.
- Volatility persisted during the quarter. Global equity markets advanced and declined along with trade tensions, Brexit news, and monetary easing amid slowing economic activity and continued low inflation.
- Despite the volatility, equity markets remain resilient, even as global growth slows, earnings growth decelerates sharply, and valuations are stretched.
Global Market Highlights
- Following an 18.5% increase in the first half, the S&P 500 rose 1.7% in the third quarter. In a reversal from the first half, value outperformed growth in the third quarter. As reported by Morningstar, among US Funds, large value (+1.52%), large blend (+1.45%) and mid-cap value (+0.41%) performed best in the quarter. Small growth -down 4.17% – was by far the worst performing US Fund category.
- Sector performance reflected the slower rate of economic growth and falling interest rates. Real Estate (+6.89%) and Utilities (+6.72%) were by far the top performers. Energy (-10.16%), Health (-6.34%) and Natural Resources (-5.45%) were the worst.
- International equity performance was mixed during the quarter, rising and falling with trade, Brexit and Middle East conflict news. Japan (+2.94%) was the only non-US market in the black. India (-5.07%), China (-4.22%) and Latin America (-3.37%) were the worst performers.
- Commodities (-1.84%) fell during quarter, with both Agricultural (-6.15%) and Energy (-4.53%) declining and Precious and Industrial Metals rising 5.28% and 2.44%, respectively.
Outlook – Climbing A Wall Of Worry…Until We Get To The Top
On the positive side, as of today, it appears that the UK and European Union have paved the way for an amicable Brexit, US-China trade talks are back on track, and US growth is decelerating but remains positive – despite the shenanigans in Washington. Of course, any or all of these could reverse tomorrow. On the negative side, the deceleration in economic growth outside the US is gathering steam. In fact, the International Monetary Fund (IMF) recently said the US-China trade war will cut global growth to the slowest pace since the 2008-2009 financial crisis. In addition, equity valuations are stretched, and more negative EPS pre-announcements were issued heading into the third quarter than in any quarter since FactSet began tracking the data in 2006.
All in all, the data points to a market decline. However, equity markets are telling us investors believe Central Banks have the wherewithal to save the day. In fact, according to FactSet, even after record closes, analysts still predict an 8% plus increase in the value for the S&P 500 over the next 12-months. Valuations generally are above (in some cases, well-above) the mid-point of their 10-year ranges. As a result, we believe allocation across sectors, industries, and individual stocks (also known as active management) will play a larger role in investment outcomes in the coming quarters. In the end, markets will continue to climb a “wall of worry”, until we reach a-too-difficult-to-predict-tipping-point. We anticipate modest equity returns amid higher volatility, to both the downside and the upside.
Earnings Growth Continues to Decelerate
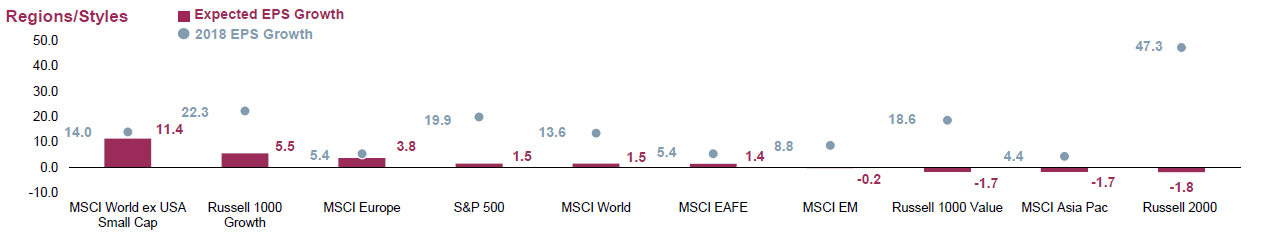
Against the backdrop of a slowing US economy, the fading benefits of the US corporate tax cut, and continuing sluggishness internationally, we anticipate a significant deceleration in the pace of US earnings growth over the next several quarters. In fact, FactSet’s tabulation of bottom-up earnings projections points toward a dramatic decline in the rate of S&P 500 earnings growth to 1.5% (down from a 2.6% forecast in the second quarter) in 2019 from 19.9% in 2018. Even Europe — which saw comparatively sluggish 5.4% earnings growth in 2018 – will see a deceleration in earnings growth in 2019 (see Figure 1).
Figure 1. Corporate Earnings Growth, Regions/Styles, 9/30/19
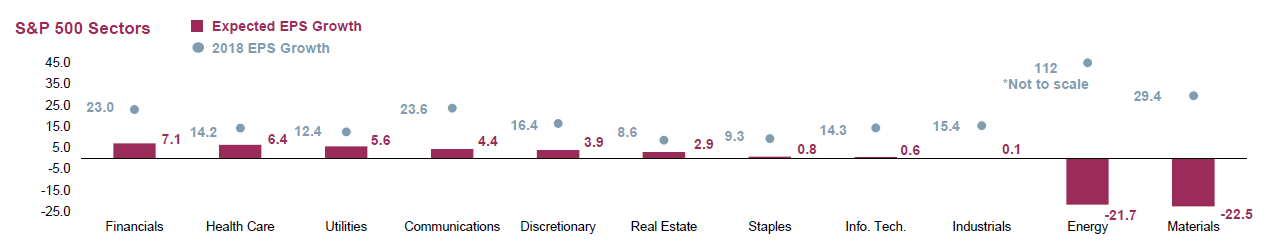
In the US, corporate earnings growth is expected to fall sharply across all S&P 500 sectors (see Figure 2) in 2019. Earnings declines of 22.5% and 21.7% are forecast for the Materials and Energy sectors, respectively, and the high-flying Information Technology sector is poised for a paltry 0.6% earnings gain. The Financials (+7.1%), Health Care (+5.7%) and Utilities (5.6%) sectors are set for the largest earnings increases in 2019.
Figure 2. Corporate Earnings Growth, S&P 500 Sectors, 9/30/19
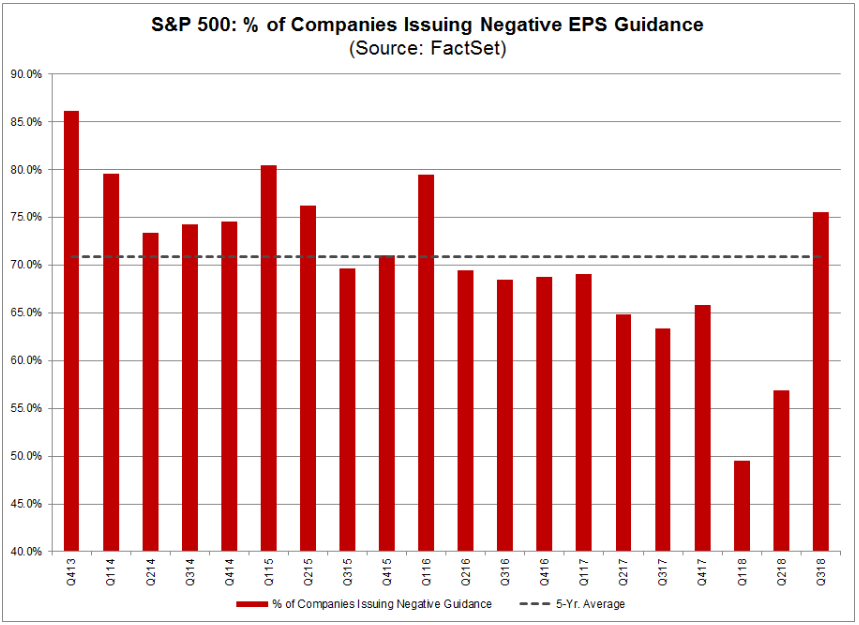
Continuing a lackluster year, third quarter earnings are set to decline by 3.7% year over year. Just as forecasts lagged reality on the upside, we anticipate continuing “negative earnings surprises” as companies and analysts scurry to catch up with deteriorating momentum over the next several quarters. This trend became apparent heading into the end of the third quarter. The number of S&P 500 companies issuing negative EPS guidance through mid-September totaled 98, which – if it is the final number for the third quarter – will be the highest number of companies issuing negative EPS guidance since FactSet began tracking this data in 2006 (see Figure 3).
Figure 3. S&P 500 Negative EPS Preannouncements: # of Companies, 9/30/19
Valuations at or Above Historic Averages
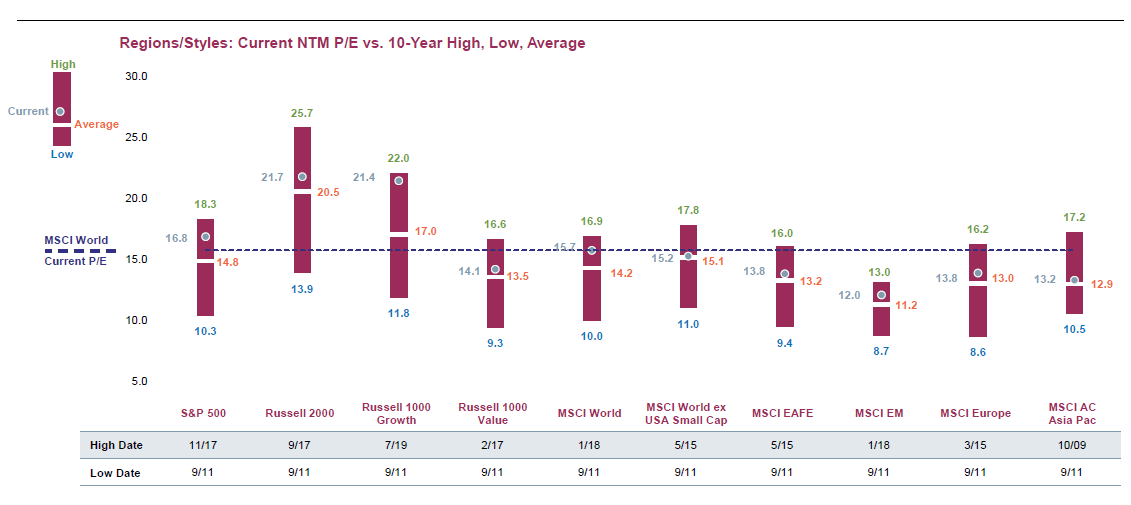
The year to date surge in equities leaves valuations at or above historic averages. The valuation of the Russell 1000 Growth index is most stretched, with a Next-Twelve-Month (NTM) Price/Earnings Ratio (P/E) of 21.4, just below the historic high of 22.0. The S&P 500, MSCI World, MSCI Emerging Markets, and MSCI Europe indices are also above their historic averages. The Russell 1000 Value, MSCI World Ex-USA Small Cap, and MSCI EAFE are in line with their history averages. Importantly, none of the indices are below their historic averages (see Figure 4).
Figure 4. Equity Valuation Analysis, Regions/Styles, 9/30/19
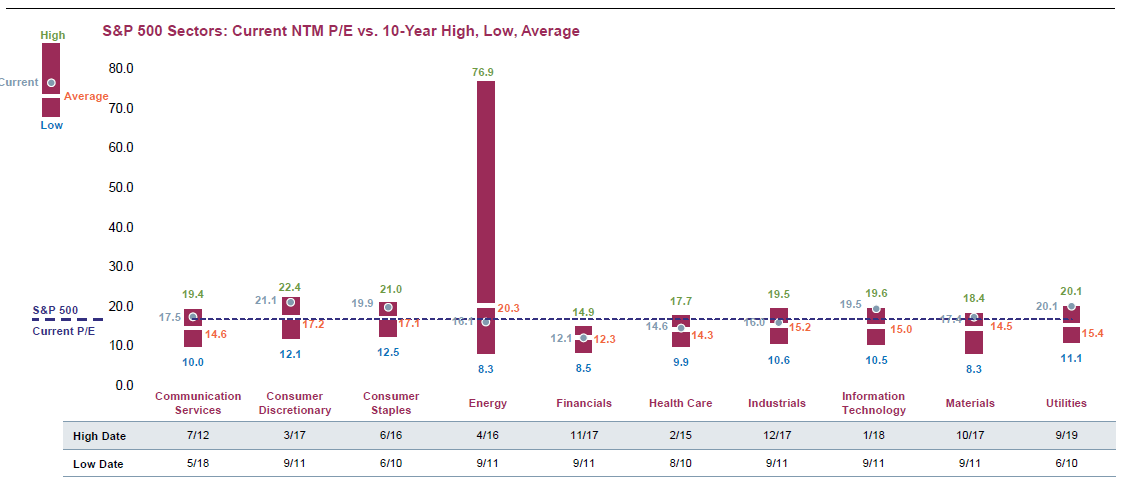
Looking at the sector perspective, Consumer Discretionary, Information Technology, and Utilities are most overstretched from a valuation perspective. Only the Energy sector, which will show an earnings decline in 2019, is trading below its 10-year average NTM P/E (see Figure 5).
Figure 5. Equity Valuation Analysis, S&P 500 Sectors, 9/30/19
We anticipate continued volatility and mixed, choppy returns across stocks, sectors and geographies amid the reality of stretched valuations and reduced earnings expectations in the coming months. However, barring an economic recession, we are looking for modest overall gains in equity markets through 2019.
Achieving Long-Term Investment and Impact Objectives
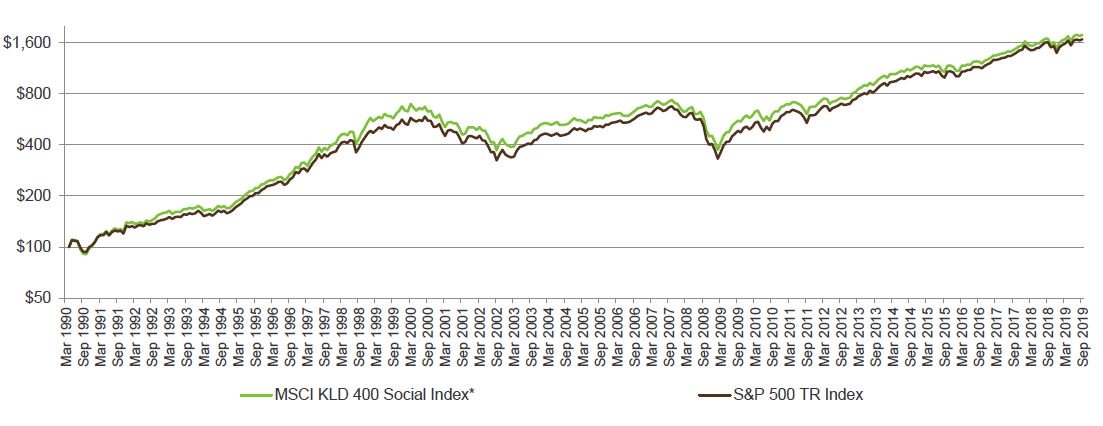
As shown in Figure 6, the MSCI KLD 400 index continues to track the S&P 500 index. The sustained, consistent relative performance of this standard SRI benchmark supports our view that sustainable, responsible, and impact investing and mainstream financial returns are not mutually exclusive.
Figure 6. MSCI KLD 400 vs S&P 500 Indices, 9/30/19
As always, everything we do at First Affirmative is driven by our dedication to enabling advisors to deliver financial results to clients and belief in the power of capital to bring about lasting environmental and social change. Our three Sustainable Investment Solutions – Custom, Multi-Manager, and Managed Mutual Fund – are built to enable clients to achieve their financial goals over the long term, along with their individual environmental, social, governance, ethical, and values-based objectives. Each portfolio is carefully constructed to be well diversified across assets, sectors, geographies, securities, and management styles –– and designed to weather periods of uncertainty and volatility.
Quarterly Bond Market Overview
Provided by Wasmer Schroeder
Could It Happen Here??
By: Tom Richmond, Chief Investment Officer
It was a busy third quarter in the bond markets, although not as volatile when taken as a whole, as the constant social-media-driven shifts in investor sentiment would lead one to believe. As the global economy continued to slow, especially outside the US, rates fell around the world in lock step. The world’s Central Banks continued to dish out copious amounts of monetary policy accommodation, although the US Federal Reserve was perhaps a bit less aggressive than their foreign colleagues and market expectations, leading to a somewhat flatter yield curve in the US. As the economic data continued to generally be good in the US, and seemed to moderate somewhat abroad, rates began to rebound in September; this should leave these same Central Bankers with some more interesting decisions ahead. All in all, however, when looking at this dynamic, and noting slightly higher stock prices and largely unchanged risk spreads in our markets, the quarter will be remembered best as unremarkable, from our perspective.
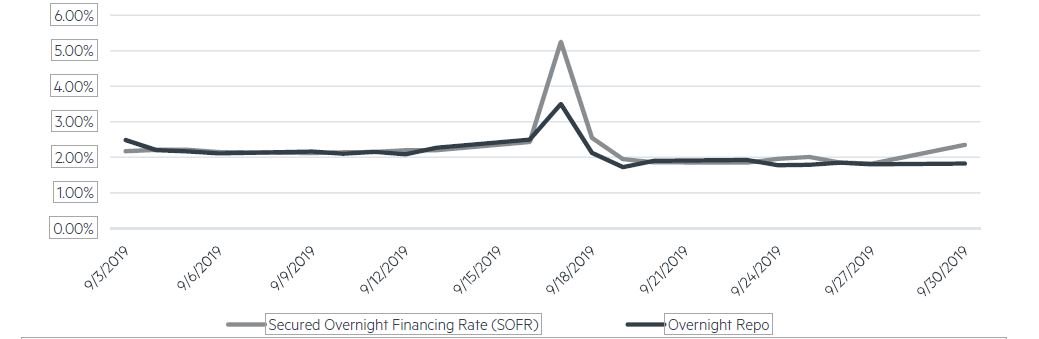
What was remarkable for me, personally, during the quarter was the number of opportunities I had to speak with clients when compared to quarters past. As is usual, many of these calls were simply to discuss current market conditions, our outlook, and our current thinking on positioning. Two topics, however, were recurring themes. For about ten days in the middle of September, I fielded several calls looking for both an explanation of the problems that emerged in the short-term funding (aka repo) markets, and for some assurance that these problems were not signaling the same types of stresses that revealed themselves at the onset of the financial crisis (spoiler alert: they were not). The other theme was more interesting I think, both in that it was framed in several different ways, but also in that I hadn’t really been queried about it before: Will we ever see negative interest rates in the US that permeate so much of the rest of the world? Great question.
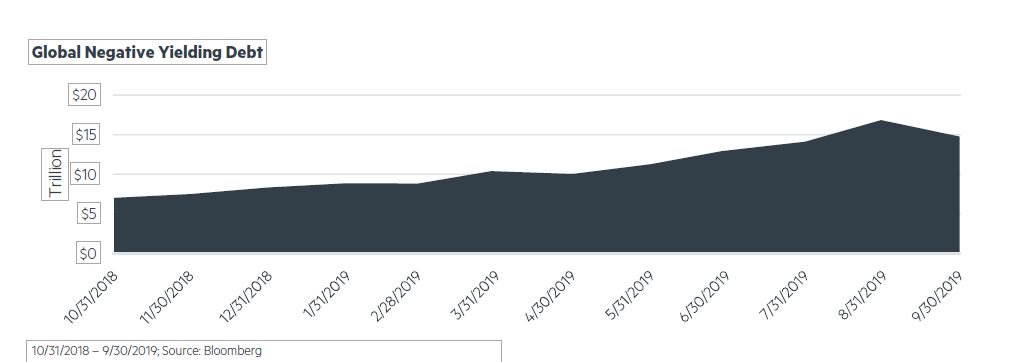
Mathematically, of course, we certainly could. Some Treasury Inflation Protected securities (TIPs) traded at negative yields in late August (hope everyone’s systems were ready for that one), but other than these ‘real’ yields we have not seen the same phenomenon now plaguing roughly $15 billion of foreign sovereign debt. Beyond this observation, you must dig a little deeper and parse the market into smaller bites. Could nominal US Treasury yields go negative? This would probably be the sector most likely to do so, but only if things actually deteriorate much further from here, and the Federal Open Market Committee (FOMC) lowers its policy rate to the Zero Lower Bound or below. This is also the case because certain groups of investors are mandated for various reasons to have allocations to USTs, and as a result have to pay the going rate regardless of what it is, the same dynamic that has caused overseas investors to continue to buy, say, 10-year German Bunds below -0.70%. Do we think this will happen here? Never say never, I guess, but I can say with some confidence that it certainly won’t before I write again after the holiday season. Hopefully, and most importantly because savers should never have to pay someone for the right to lend them money, this will never be the case.
The happier news for our clients is that the road to negative rates in the sectors in which we invest is a lot harder to see. Absent some sort of Quantitative-Easing-on-Steroids by our Fed, corporate bonds should be exempt, as the economic conditions that could lead USTs down would probably widen risk spreads to some extent, helping them remain above water. The logic that could lead tax-exempt municipals to such levels is even harder to see. Given that tax-frees are held to a much greater extent by individuals either outright or through mutual funds or ETFs, we believe that, even were these yields simply to approach zero, selling would be brisk, as most folks would rather sit in cash than buy investments for their personal accounts doomed to lose money over time unless the next buyer was willing to lose even more. That all said, this is obviously a crucial issue, especially for those of us who make our livings managing bond portfolios, and one that we will continue to discuss often. With any luck, Santa will bring us all an improving global economy when he comes around in a couple of months, and the concept will be much further removed from our day-to-day thinking.
Disclosure
The material provided is for informational purposes only and contains no investment advice or recommendations to buy or sell any specific securities. The statements contained herein are based upon the opinions of Wasmer, Schroeder & Company (WSC), the data available at the time of the presentation which may be subject to change depending on current market conditions. This presentation does not purport to be a complete overview of the topic stated, nor is it intended to be a complete discussion or analysis of the topic or securities discussed. All opinions and views constitute our judgments as of the date of writing and are subject to change at any time without notice. WSC does not accept any liability for any loss or damage arising out of the use of all or any part of this presentation. This report should not be regarded by recipients as a substitute for the exercise of their own judgment and may contain numerous assumptions. Different assumptions could result in materially different outcomes. Please contact Wasmer, Schroeder & Company for more complete information, including the implications and appropriateness of the strategy or securities discussed herein for any particular portfolio or client.
Wasmer, Schroeder & Company (WSC) is an investment advisor specializing in fixed income separate account portfolio management for high net worth individuals, wealth management groups and institutions, including foundations, banks, endowments and retirement plans. WSC has $8.89 billion in total assets under management as of 12/31/2018. The Firm works with advisors and clients to provide taxable and tax exempt fixed income portfolio solutions to meet their needs. The Firm’s corporate headquarters is in Naples, Florida, where the Tax Exempt Portfolio Management Team, Research, Client Services, Operations, IT, Accounting, Administration, Compliance, Communications & Data Analytics are located. Our Taxable Portfolio Management Team is located in Cleveland, Ohio. Client Relationship offices are located in Exton (Philadelphia area), Pennsylvania; New York, New York; and Portland, Oregon.
NOTE: Indexes are not available for direct investment. Mention of a specific company or security is not a recommendation to buy or sell that security. Past performance is never a guarantee of future results.