
Buy on the Rumor, Sell on the News
By Theresa Gusman, Chief Investment Officer | Download PDF
- US equities continue to hit new highs. A 9.1% fourth quarter surge propelled the S&P 500 to a 31.5% increase in 2019 – and the index continues to advance.
- A mixed start to 2019 yielded to strong fourth quarter gains in international equity markets. The MSCI ACWI, Ex US index advanced 8.9% in the fourth quarter and 21.5% in 2019.
- Volatility diminished during the gradual climb in global equity prices. In fact, according to the Wall Street Journal, as of mid-January the stock market is in one of its longest historic streaks without a daily move of 1% or more.
- Amid the improving global economic and earnings backdrops, global markets look poised to continue to shrug off myriad geo-political risks and stretched valuations in the near term. As we move through the year and the election looms, we anticipate increased volatility in the US – which could provide a chance for international equity markets to stage a relative comeback.
Global Market Highlights
- The S&P 500 surged 31.5% in 2019. Following a brief third quarter reversal, growth significantly outperformed value in both the fourth quarter and the year. As reported by Morningstar, large cap growth funds advanced 31.90% in 2019, superseded only by mid-cap growth, up 32.52%. The small value category performed worst – and was still up 21.43% in 2019.
- US sector performance reflected a “flight to quality” amid increased geo-political risk, combined with rising confidence that the slower rate of economic growth would yield to a late year pick up in 2019. Precious metals (+38.98%), technology (+37.49%), and industrials (+28.39%) were the top performing sector categories. Energy (+7.25%) and natural resources (+14.95%) fared worst.
- International equity performance was mixed in 2019. The Latin America stock fund category topped the performance charts, rising 28.37% and India was at the bottom (+2.32%).
- In alternatives, commodities grossly lagged equities in 2019, with the Bloomberg Commodity Index rising just 7.69% despite golds strong showing. Real estate fared better, with US real estate funds rising 27.19%.
Outlook – Buy on the Rumor, Sell on the News
Wall Street is known for its clichés. Throughout 2019, we were “climbing a wall of worry”. Worries included the global economic slowdown, lackluster earnings growth, US-China trade negotiations, Brexit, Middle East tensions, uncertainty in Russia, and impeachment. With these worries receding and markets hitting fresh highs, we must decide whether to stick with the allocations that have worked for the better part of the past decade – large cap US equities, particularly technology – or shift toward far less expensive SMID and non-US stocks. To assess whether, “the trend is your friend” or we should, “buy on the rumor, sell on the news”, we looked objectively at the global economic outlook, earnings expectations, equity valuations, yields, and US technology dominance.
In the end, we believe much of the extraordinary 2019 US equity market performance reflected persistent skepticism that economic activity could possibly remain strong after years of increases, earnings could continue to grow, valuations could remain stretched, and US technology companies could get bigger, despite their size. Yet US employment reports and earnings releases proved the skeptics wrong. And technology innovation and growth proved resilient. In fact, Apple (AAPL) and Microsoft (MSFT) alone comprised 14.8% of total S&P 500 returns in 2019. If you didn’t spend hours searching for Apple AirPods Pro this holiday season, you’re lucky, and on January 16, 2020, Alphabet (GOOGL) was the fourth US technology giant to surpass $1 trillion in market capitalization.
The news is good, as anticipated by the market (if not the pundits). What now? We believe modest gains are possible through the first half of 2020. However, as the Presidential election – and the changes it could bring to US regulatory, corporate structure, tax, and social regimes – becomes the singular focus of market participants, we anticipate a period of significant volatility. In the end, the performance of US equity, fixed income, and currency markets – in both absolute and relative terms – for 2020 and beyond will depend on the election outcome.
Earnings – Acceleration on the horizon
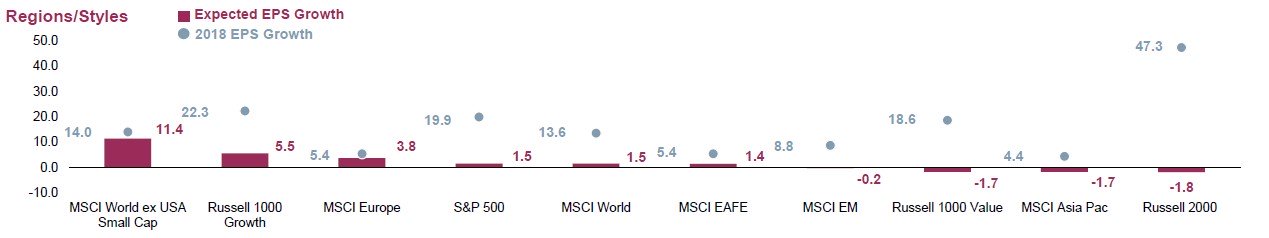
Recent releases confirm that corporate earnings growth slowed significantly in 2019 from 2018 against the backdrop of a slowing US economy, the fading benefits of the US corporate tax cut, and sluggishness internationally (see Figure 1). We believe earnings growth will pick up as we move into 2020, with easier year to year comparisons, accelerating economic activity, and an improving trade picture underpinning modestly higher profits this year.
Figure 1. Corporate Earnings Growth, Regions/Styles (12/31/19)
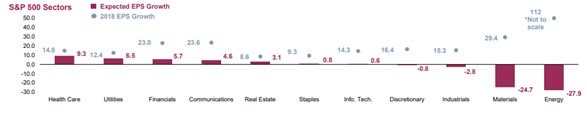
US corporate earnings growth will fall sharply across all S&P 500 sectors (see Figure 2) in 2019 – although in contrast to earlier expectations most sectors are now expected to post modest gains. The Health Care, Utilities, and Financials sectors are slated to post the largest earnings increases for 2019, while Energy, Materials, and Industrials are at the bottom.
Figure 2. Corporate Earnings Growth, S&P 500 Sectors (12/31/19)
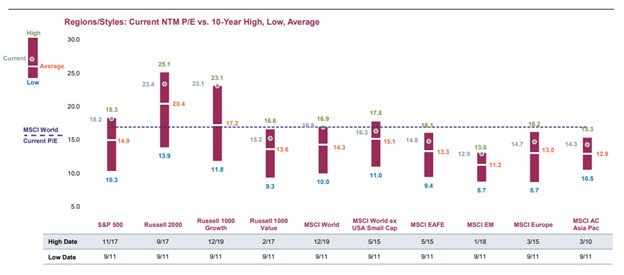
Valuations at or above historic averages
The 2019 surge in equities leaves valuations at or above historic averages. The valuation of the Russell 1000 Growth index is most stretched, with a Next-Twelve-Month (NTM) Price/Earnings Ratio (P/E) of 23.1 – at its historic high. The MSCI World is also at a historic high valuation, and other indices are close. The MSCI AC Asia Pacific, MSCI Europe and MSCI Emerging Markets are least expensive – albeit still above historic averages (see Figure 3).
Figure 3. Equity Valuation Analysis, Regions/Styles, 12/31/
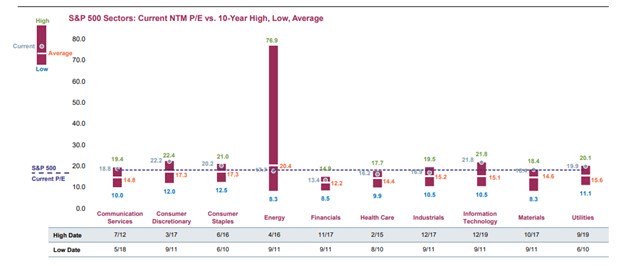
From a sector perspective, Communication Services, Consumer Discretionary, and Consumer Staples are most over-stretched from a valuation perspective. Only the Energy sector, which will show earnings decline in 2019 and likely is on a long-term downward trajectory, is trading below its 10-year average NTM P/E (see Figure 4).
Figure 4. Equity Valuation Analysis, S&P 500 Sectors, 12/31/19
Achieving Long-Term Investment and Impact Objectives
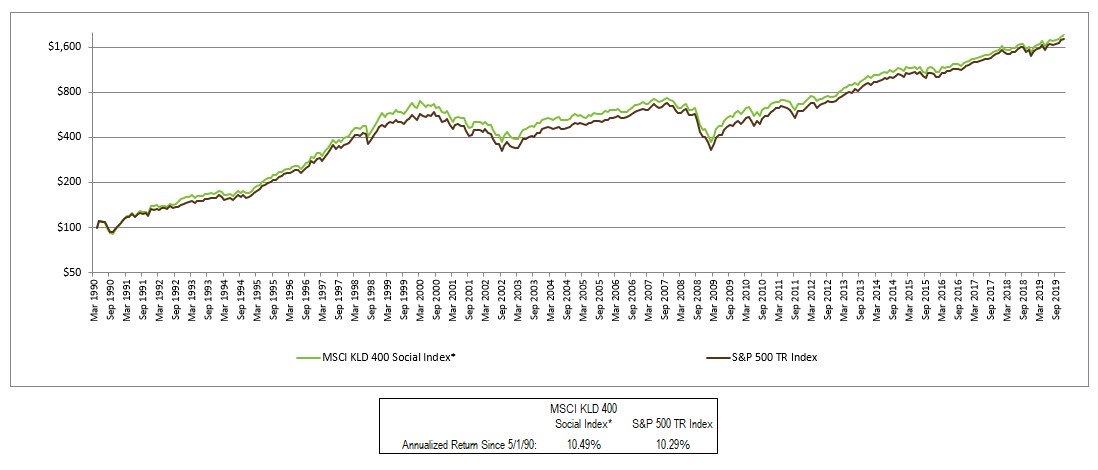
As shown in Figure 5, the MSCI KLD 400 index continues to track the S&P 500 index. The sustained, consistent performance of this standard SRI benchmark supports our view that sustainable, responsible, and impact investing and mainstream financial returns are not mutually exclusive.
Figure 6. MSCI KLD 400 vs S&P 500 Indices, December 31, 2019
As always, everything we do at First Affirmative is driven by our dedication to enabling advisors to deliver financial results to clients and belief in the power of capital to bring about lasting environmental and social change. Our three Sustainable Investment Solutions – Custom, Multi-Manager, and Managed Mutual Fund – are built to enable clients to achieve their financial goals over the long term, along with their individual environmental, social, governance, ethical, and values-based objectives. Each portfolio is carefully constructed to be well diversified across assets, sectors, geographies, securities, and management styles –– and designed to weather periods of uncertainty and volatility.